Sunday, February 16, 2014

Is Washington D.C. the Problem?

On December 17th, the Washington Business Journal posted an article titled "D.C. far outpaces nation in personal earnings". It began:

D.C. residents are enjoying a personal income boom.

The District’s total personal income in 2012 was $47.28 billion, or $74,733 for each of its 632,323 residents, according to the Office of the Chief Financial Officer’s Economic and Revenue Trends report for November.

The U.S. average per capita personal income was $43,725. The highest of the 50 states, Connecticut, fell 25 percent short of D.C.

The article concludes:

The numbers suggest D.C. residents are living the high life. Some are, but, of course, it’s not that simple. Poverty is entrenched in many D.C. neighborhoods, especially east of the Anacostia River, where earnings are virtually nonexistent and the need for social services is dire. But as long as the District is booming on a per capita basis, the money should be available to help.

As it turns out, the $74,733 and $43,725 figures are slightly in error. They come from page 1 of the article's source but on page 17 of that source and on the BEA web site, the numbers are given as $74,773 and $43,735. Still, googing the erroneous numbers turns up a number of articles whose titles suggest conclusions that are less subdued than those drawn by the Business Journal. Just the first page of the google results include Who's Really Making Out Like Bandits in Obama's Economy?, As Unemployed Lose Benefits DC Enjoys A Wonderful Year Of Patronage, Fat City, Living High on the Hog, and It’s a Very Merry Christmas for Washington’s Parasite Class. This last article is by Daniel J. Mitchell of the Cato Institute and is reposted here, here, and here and is referenced on numerous other pages. In it, Mitchell cites the prior figures and states the following:

Why is income so much higher? Well, the lobbyists, politicians, bureaucrats, interest groups, contractors, and other insiders who dominate DC get much higher wages than people elsewhere in the country.

He goes on the reference an article titled Lobbying: A Terrific Investment and, following a link to a Reason TV interview with Andrew Ferguson of the Weekly Standard, he concludes:

I particularly like his common sense explanation that Washington’s wealth comes at the expense of everyone else. The politicians seize our money at the point of a gun (or simply print more of it) to finance an opulent imperial city.

So if you’re having a hard time making ends meet, remember that you should blame the parasite class in Washington.

Is Washington D.C. an "opulent imperial city" that is to blame for some of us "having a hard time making ends meet"? To answer that, it would seem that we need to do more than just compare the per capita personal income of D.C. against that of the entire United States. After all, D.C. is a single city and the U.S. is an entire country. At the very least, it would help to look at other cities. It might also be good to look at entire metropolitan areas so as to capture more of the people who are working in the city or as lobbyists and contractors to the government.

The following graph shows the 10 metropolitan areas which had the highest per capita personal income in 2012.

Per Capita Personal Income, Top 10 Metropolitan Areas in 2012

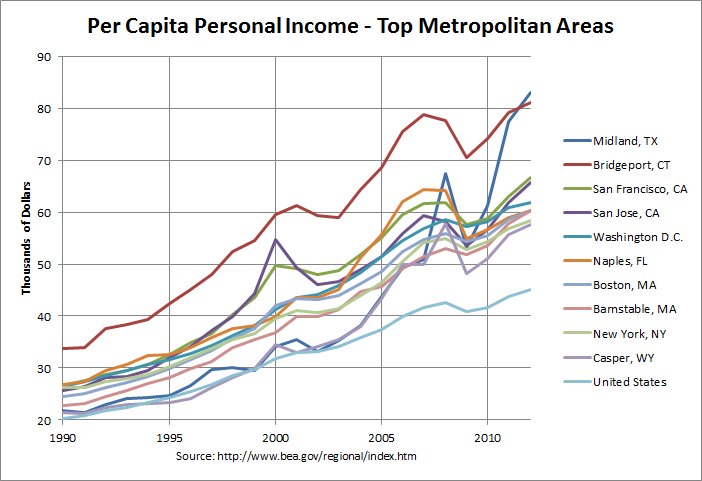
The numbers and sources for this and the following graph can be found at this link. Surprisingly, the metropolitan with the highest personal income is Midland, Texas. A recent article titled "Oil-rich Midland, TX is nation’s fastest growing metro area, with highest per-capita income in the country at $83,000" states:

For the third year in a row, Midland was the nation’s fastest growing MSA, with growth in personal income in 2012 of 12.1%. Midland also led the country as the MSA with the highest per capita personal income in 2012 at $83,049, followed by Bridgeport-Stamford-Norwalk, CT ($81,068), San Francisco ($66,591), the Silicon Valley MSA of San Jose-Santa Clara-Sunnvale ($65,679) and Washington, DC ($61,743).

The article goes on the explain that "America’s Shale Revolution is creating shale-based wealth, income, jobs and prosperity, especially in the states of Texas and North Dakota". This also likely has much to do with the recent rise of Casper, Wyoming to number 10 on the list.

A Bloomberg article from two years ago titled Rich Man, Poor Man: Connecticut Tops U.S. Wealth Gap says the following about the Bridgeport-Stamford-Norwalk metropolitan area:

In the Bridgeport-Stamford-Norwalk metro area, 53,076 households took home at least $200,000 -- and 16,505 earned less than $10,000.

“This region is a microcosm of the U.S.,” Pearson said.

Exacerbating the gap are the ranks of wealthy residents who have grown richer as the region became a hub for investment firms and hedge funds, she said. Median household income hovers 60 percent above the national figure at about $80,000.

Hence, this article suggests that the high income has some relation to the area becoming a hub for investment firms and hedge funds. In any case, the Washington D.C. metropolitan area does not stand as an "opulent imperial city" in terms of per capita personal income. How about in terms of the total personal income? The following graph shows the 10 metropolitan areas which had the highest total personal income in 2012.

Total Personal Income, Top 10 Metropolitan Areas in 2012

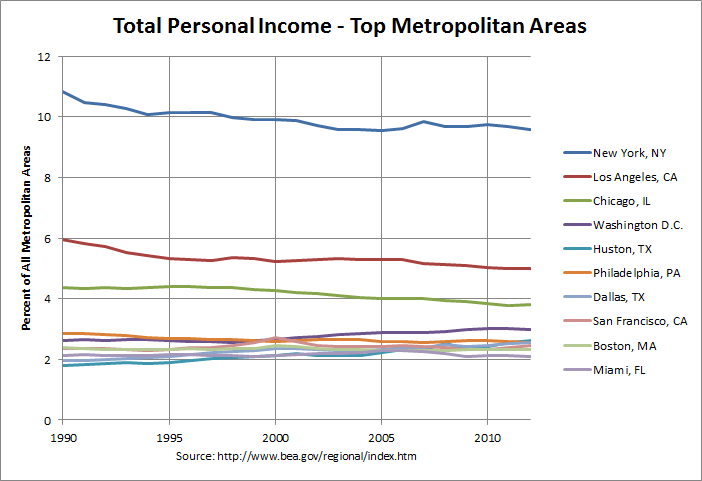
The graph shows each metropolitan area's total personal income as a percent of the total personal income of all metropolitan areas in the U.S. This was about $12.095 trillion in 2012. It should be noted that this was actually 88.1 percent of the total personal income in all of the U.S. in 2012 of about $13.729 trillion. The difference is that the latter figure includes the rural (non-metropolitan) areas.

The above graph is a little more as expected with the New York City area having by far the highest total personal income, followed by the Los Angeles area and then the Chicago area. As can be seen, the Washington D.C. area is fourth with just about 3 percent of the total personal income of all metropolitan areas. Hence, it's difficult to see how those who are having a hard time making ends meet should lay all blame on the "parasite class in Washington", as Mitchell describes them.

There does seem to be some agreement among many members of both parties that there is a problem with lobbyists, interest groups, and other insiders in Washington. However, there seems to be much disagreement about what to do about it. Some groups promote reforms of our campaign financing and other laws to better regulate these groups. In contrast, Mitchell ends his article with the following line:

P.P.P.S. Making government smaller is the only way to reduce the Washington problem of corrupt fat cats.

In any event, the above discussion shows the importance of looking at as much and as varied a selection of data as possible when studying economic issues. Even the above two graphs have their limitations. They say nothing about the distribution of income within those metropolitan areas and give no information as to what is going on immediately outside those areas. However, they give much, much more information than the simplistic comparison of one measure of a single city against an entire country.

Sunday, February 2, 2014

Ben Bernanke and the Federal Reserve Balance Sheet

January 31st marked the end of Ben Bernanke's 8-year tenure as Federal Reserve Chairman. An article titled "Bernanke Leaves Fed with Record Balance Sheet of $4,102,138,000,000" gives a short history of the actions of the Fed and growth in the Fed Balance Sheet during that time. Following is a short summary of the actions taken from there and Wikipedia:
DATES AND DESCRIPTIONS OF FEDERAL RESERVE ACTIONS

Program   Start      End     Securities purchased
-------  --------  --------  --------------------
QE1      Dec 2008  Mar 2010  agency mortgage-backed securities (MBS) and agency debt, up to $600 billion total
         Mar 2009  Mar 2010  expanded to $1.25 trillion in MBS, $175 billion in agency debt, and $300 billion in treasuries
QE2      Nov 2010  Jun 2011  longer dated treasuries, at a rate of $75 billion per month for a total of $600 billion
Twixt    Sep 2011  Dec 2012  longer dated treasuries with funds from selling shorter dated treasuries, total of $400 billion
QE3      Sep 2012  Present   agency mortgage-backed securities (MBS) at a rate of $40 billion per month
         Dec 2012            added longer dated treasuries, at a rate of $45 billion per month (same rate as Twixt)
         Jan 2014            cut back to $35 billion MBS and $40 billion in treasuries per month
         Feb 2014            cut back to $30 billion MBS and $35 billion in treasuries per month
         Mar 2014            cut back to $25 billion MBS and $30 billion in treasuries per month
         Apr 2014            cut back to $20 billion MBS and $25 billion in treasuries per month
The effect of these programs on the federal reserve balance sheet can be seen in the following graph:

federal reserve balance sheet

As can be seen, federal reserve assets jumped sharply toward the end of 2008 in response to a number of Fed programs. These programs are shown in more detail in graphs and tables at this link. Then, mortgage-backed securities (MBS) are seen to grow sharply from early 2009 to early 2010 in response to Quantitative Easing 1 (QE1). Then, treasuries are seen to grow sharply from then end of 2010 to mid-2011 in response to Quantitative Easing 2 (QE2). Operation Twixt, which went from late 2011 to the end of 2013 is not visible because the changes occurred entirely within the purple area of "Other U.S. Treasuries" where longer dated treasuries were bought with the funds from selling shorter dated treasuries. However, both mortgage-backed securities (MBS) and treasuries are seen to grow sharply from the end of 2012 to the present in response to Quantitative Easing 3 (QE3).

The Federal Reserve website has an excellent program for downloading and graphing this data at this link. The data for the above graph is posted at this link and was downloaded via this program. This program was also used to generate the following graph:

federal reserve balance sheet from site

This graph looks very similar to the first graph but differs in that it is not a "stacked-area" graph. As a result, mortgage-backed securities (the red line) are shown separately from the U.S. Treasury securities (the green line). As can be seen, the Federal Reserve assets consisted chiefly of U.S. Treasuries before the financial crisis but its holdings of mortgage-backed securities briefly surpassed its treasury holdings in 2010 in response to QE1. However, the Fed's treasury holdings came back to surpass its MBS holdings with QE2 and that has continued as both have grown with QE3.

There is some disagreement as to the effects of these programs. On January 31st, the PBS Newshour had a segment titled "How economists grade Ben Bernanke’s Federal Reserve tenure". The following excerpt from the transcript shows a apparent disagreement between the conservative economist Charles Calomiris and Alan Blinder, a past vice chairman of the Fed, apparently over the wisdom of QE3:

CHARLES CALOMIRIS: The Fed under Bernanke in the last two years has created inflationary risk that could be hard for his successors to manage. What he created was a risk of inflation over the next five years, in exchange for getting very small potatoes in terms of improvement in the economy over the past two years.

PAUL SOLMAN: That risk is why Calomiris gives Bernanke a post-crash grade of incomplete.

But Alan Blinder calls inflation fears baseless.

ALAN BLINDER: For years, there was going to be inflation next year, inflation next year. Wrong, wrong, wrong, wrong. We haven’t had any inflation. Lately, since there’s no inflation, often, it’s the same people have started this, it’s causing speculative bubbles.

So let’s see, where? House prices? I don’t think so. They have recovered about one-third of what they lost, and it looks like they’re kind of leveling off. Can’t tell. Stock prices? Well, maybe, but, you know, we have extraordinarily high profits. We have extraordinarily low interest rates. On basic fundamentals, stock prices should be high. I don’t stay awake worrying about bubbles now.

On the other hand, Richard Fisher, President of the Federal Reserve Bank of Dallas, discussed what he believed to be the costs and benefits of the programs on a recent episode of EconTalk. In the following excerpt from the transcript, he discusses the costs:

And I'm worried about the long-term consequences of having all that money sitting out on the sidelines. These are in depository institutions as well as significant amounts of money sitting in private equity firms and sitting in hedge funds, etc., outside our purview. That's a lot of tender. If velocity were to pick up, how do we tamp it down so that it doesn't lead to inflationary impulses? Right now inflation is not an issue. But our charge, given to us by the Congress, says long run, long run, long run. And that's what I'm worried about. Those are the costs that I'm worried about.

He then goes on the discuss the benefits:

And the benefits? Well, I'll be blunt about this. Mr. Druckenmiller said this on television the other day: this is great for rich people; it's great for Warren Buffett. Bless his heart, he's a good investor. Good for Mr. Druckenmiller and others, they get money for free. It hasn't done what we wanted it to do, which is lead to greater job creation for the two middle income quartiles.

My impression is that there is general agreement that Bernanke handled the immediate aftermath of the financial crisis well. In the Newshour interview, both Blinder and Calomiris gave Bernanke an A for that period. However, there seems to be much less agreement on the Fed's recent policies. Much will likely depend on how things play out and whether the Federal Reserve is able to unwind its balance sheet without any major problems. As Paul Solman said at the end of the Newshour segment:

And so, as Ben Bernanke leaves office after what everyone agrees is an unforgettable eight years on the job, his final grade probably won’t come for years, during the tenure of successor Janet Yellen, or maybe even later than that.

Tuesday, January 28, 2014

Do Publications Have Any Responsibility to Screen Their Editorials? (Part 4)

Do Publications Have Any Responsibility to Screen Their Editorials? (Part 4)

At the end of my last post, I said that it would be interesting to see if the Wall Street Journal finally corrects the online version of Brett Stephens's column, "Obama's Envy Problem". As it happens, they have finally done so. I first noticed it when I rechecked the site after my last post late on January 20th. According to a blog post by Paul Krugman titled "Department of Corrections, and Not", the column was still uncorrected when he checked it a few minutes before his posting at 1:40 PM on January 20th. Hence, the Journal may have corrected it shortly after that. I may have initially missed it because they posted the correction at the end of the column. The correction reads as follows:

Corrections & Amplifications

Inflation-adjusted income data from the U.S. Census Bureau show that incomes declined by 2.6% for the bottom quintile between 1979 and 2012, increased by 5.7% for the middle class (third quintile), and by 42% for the top quintile. This column used non-inflation adjusted income figures.

An interesting blog post titled "Bret Stephens and Paul Krugman: What Should a Correction Look Like in the Digital Era?" discusses what an online correction should look like. The Journal did in fact follow the advice not to do a "silent edit" after a column's errors become the basis for other people’s posts. However, there may have been additional reasons that the Journal did not do a silent edit. Once the nominal figures are corrected for inflation, the entire argument put forth by the column pretty much falls apart. For this reason, it might be better if the Journal puts the correction before the column rather than after it. That will save future readers the time and effort of reading it. Coming at the end, the correction should likely begin with the words "Never mind!". Still, it is good to see that the Journal did correct the online column. Hopefully, this might help lead to a policy of doing this on all corrected articles posted by the Journal and other publications. However, that does leave open the question in the title of this post. To what degree do publications have the responsibility to screen their columns and catch these obvious errors to begin with?

Monday, January 20, 2014

Do Publications Have Any Responsibility to Screen Their Editorials? (Part 3)

In my last post, I pointed out that the Wall Street Journal website is still displaying the same editorial with the same non-inflation-corrected numbers for which they had posted a correction. I concluded that it will now be interesting to see if the Wall Street Journal corrects it.

As of this posting, the Wall Street Journal has still not corrected it and I was therefore happy to see Paul Krugman also take up this issue. On January 19th, a Krugman column titled "The Undeserving Rich" was posted on the New York Times website. In it, he stated:

For an example of de facto falsification, one need look no further than a recent column by Bret Stephens of The Wall Street Journal, which first accused President Obama (wrongly) of making a factual error, then proceeded to assert that rising inequality was no big deal, because everyone has been making big gains. Why, incomes for the bottom fifth of the U.S. population have risen 186 percent since 1979!

If this sounds wrong to you, it should: that’s a nominal number, not corrected for inflation. You can find the inflation-corrected number in the same Census Bureau table; it shows incomes for the bottom fifth actually falling. Oh, and for the record, at the time of writing this elementary error had not been corrected on The Journal’s website.

On his blog, Krugman added a post titled "Department of Corrections, and Not" which recounts that Bret Stephens has contacted the Times to protest his contention that Stephens' error in using nominal incomes has not been corrected on the WSJ’s website. Krugman goes on to explain that Stephens is apparently referring to this correction but that that is not what he calls a "correction". He continues:

What, after all, is the purpose of a correction? If you’ve misinformed your readers, the first order of business is to stop misinforming them; the second, so far as possible, to let those who already got the misinformation know that they were misinformed. So you fix the error in the online version of the article, including an acknowledgement of the error; and you put another acknowledgement of the error in a prominent place, so that those who read it the first time are alerted. In the case of Times columnists, this means an embarrassing but necessary statement at the end of your next column.

Nothing like that happened in Stephens’s case. Someone reading his original column on line will see exactly the same piece that was originally published, bogus statistics and all, with no hint of a problem and no link to his mea culpa.(Or at least that was true a few minutes ago — maybe they’ll scramble to fix it now.) Maybe one in a hundred will hear somewhere that there was a problem — but for everyone else the misinformation is continuing to spread.

Krugman need not have worried as there appears to be nobody at the Journal scrambling to fix the original editorial. As of this moment, it has still has not been corrected. By the way, if you attempt to view the original column directly, you will likely just see the first few lines with a prompt to subscribe. However, there is an alternative method that usually seems to view the entire article. Go to google.com, search for "Obama's Envy Problem", and then click on the first item which should be titled "Bret Stephens: Obama's Envy Problem - WSJ.com". This should bring you to the same URL but show the entire article. It may be best to use Internet Explorer for this as Chrome does not always seem to show the whole article. As can be seen, the increase of 186% for the bottom 20%, based on nominal numbers, is still there.

Rather than fix the original editorial the Journal has posted a response by Stephens titled "Stephens: Krugman and the Ayatollahs". In it, Stephens states that "a formal correction was posted on Jan. 5 and I addressed the subject at length on Jan. 3". Can't anyone at the Journal read? Do they truly not understand that Krugman is talking about correcting the original editorial still posted online? Why hasn't the Journal corrected it? A cynical person might suggest the following:

The initial editorial was read by tens or hundreds of thousands of readers and the use of nominal numbers helped to make the case that Stephens and the Journal editorial staff supported. But, as Krugman suggested, the corrections might be seen by one in a hundred of the original readers. I don't subscribe to the Journal so I don't know where those corrections were printed in the paper. But Krugman seems to indicate that a correction was not included at the end of Stephens's next column, a place where his regular readers, at least, would be likely to see it. And by leaving the original editorial uncorrected, the same editorial will be read of additional readers, likely via search engines like Google, and the same flawed numbers will continue to help make the case which Stephens and the Journal support.

Stephens also took his arguments to Twitter, tweeting the following:

Paul Krugman nastily accuses me of "crude obfuscation," in the course of which me makes a dumb factual mistake. See if you can spot it.

As someone tweets back, I think that Stephens meant "he" instead of "me". In any event, following are the final three responding tweets (at this time):

PK with an excellent point. Any "correction" should be done as an addendum to the original article.

Man up, make a legit correction, and get over it.

Why not link to your original column and Krugman's in your acknowledgement of the error? Why not note error in original column?

It will be interesting to see if Stephens responds. What will be more interesting will be if the Journal will finally correct the original editorial or include a correction at the beginning and/or end of it. If they do not, I hope that people with large readerships like Krugman continue to hold them to account. Of course, Stephens and the Journal are free to hold Krugman to account for any uncorrected columns that the Times continues to post online. However, they have not yet shown that they recognize the principle, much less are prepared to follow it.

Wednesday, January 8, 2014

Do Publications Have Any Responsibility to Screen Their Editorials? (Part 2)

At the end of my last post, I wrote:

It will be interesting to see if Stephens or the Wall Street Journal publish a correction to this egregious mistake. That might give some indication as to whether they are concerned about their reputations or are simply pushing a point of view by whatever means possible.

As it happens, a correction written by Stephens titled "About Those Income Inequality Statistics" was posted on January 3rd. In it, he admits his error in using data that had not been corrected for inflation, stating:

In my Dec. 31 column on income inequality, I used a data set from the U.S. Census Bureau to make the case that incomes in the U.S. have been growing across the board, even if the incomes of the wealthy have grown faster than those of others further down the income scale. But I wrote those lines looking at a set of numbers that had not been adjusted for inflation.

Professor Krugman, in a post on his New York Times blog, takes me to task for this. Had I done so looking at the inflation-adjusted table, it would have shown the incomes of the bottom 20% essentially stagnating since 1979 (and long before then, too), though it also would have shown incomes for the top 20% rising far less dramatically.

He goes on to mention that Krugman accuses him, not of making an honest mistake, but of "pulling a fast one". He then continues:

My mistake is all the more unfortunate because the basic point I was making is right: Americans are getting richer across the entire income spectrum, even if they are getting richer at very different rates. That much is confirmed by data from the Congressional Budget Office. The CBO finds that between 1979 and 2007 income for poor households grew by 18%, for the middle classes by nearly 40%, and for the top 81-99% by 65%. It's the top 1% who have made out very handsomely, with a jump of 275% over nearly three decades.

Hence, Stephens feels that his basic point is still right despite the fact that he was forced to switch from using Census data to CBO data to maintain it. He feels this despite the fact that he goes on to admit that the differences between Census and CBO data is complicated and ultimately subjective. In any event, the CBO numbers calculate that the income of the bottom 20 percent of households increased by 18% over the 28 years from 1979 to 2007. That works out to about 0.6 percent per year compounded.

The idea that this shows that "Americans are getting richer across the entire income spectrum" is highly debatable. As mentioned, Stephens had to go with CBO data instead of Census data. In addition, he is basing this statement on a mere four categories. The CBO data gives no indication as to the variation of income increases in the bottom 20 percent. This is especially the case when you consider the variation in inflation. Those who have been hit by high inflation in health care and higher education likely do not feel "richer". In addition, you would expect incomes to rise faster than inflation due to productivity and the real growth in the GDP. The following graph shows the growth in output and wages since 1950:

Wages versus Productivity (Wage gap): 1947-2012

As can be seen, wages generally kept up with productivity gains until the 70s but have generally lagged since. The following graph shows wages and corporate profits as a percent of GDP since 1950:

Wages and Corporate Profits: 1947-2012

As can be seen, wages as a percent of GDP stayed fairly level to the mid-70s but have generally declined since. Meanwhile, corporate profits as a percent of GDP have risen sharply since about 2001. The actual data and sources for both of these graphs can be found at this link.

In addition to Stephen's correction, the Wall Street Journal has posted a correction that reads as follows:

Inflation-adjusted income data from the U.S. Census Bureau show that incomes declined by 2.6% for the bottom quintile between 1979 and 2012, increased by 5.7% for the middle class (third quintile), and by 42% for the top quintile. Bret Stephens's column of Dec. 31 (Global View, "Obama's Envy Problem") used non-inflation adjusted income figures.

However, there is one major problem remaining. If you look at the original editorial, you'll see that nothing appears to have changed! The Wall Street Journal website is still displaying the same editorial with the same non-inflation-corrected numbers that they have posted a correction for! What is the point of the correction if you're not going to correct the original posting?

It was a positive step for Stephens and the Wall Street Journal to post corrections to this story. However, it will now be interesting to see if the Wall Street Journal corrects their original editorial. That might give some indication as to whether they are truly concerned with correcting their mistakes and limiting their effects or are simply going through the motions.

Do Publications Have Any Responsibility to Screen Their Editorials? (Part 3)

Friday, January 3, 2014

Do Publications Have Any Responsibility to Screen Their Editorials?

On Dec. 30th, the Wall Street Journal ran an editorial titled "Stephens: Obama's Envy Problem". The editorial was written by the WSJ's Bret Stephens and begins as follows:

As he came to the end of his awful year Barack Obama gave an awful speech. The president thinks America has inequality issues. What it has—what he has—is an envy problem.

Further on, Stephens states:

Mr. Obama tried to prove that in his speech, comparing present-day income with that halcyon year of 1979: "The top 10 percent no longer takes in one-third of our income—it now takes half," he said, suggesting that the rich are eating a larger share of the national pie. "Whereas in the past, the average CEO made about 20 to 30 times the income of the average worker, today's CEO now makes 273 times more. And meanwhile, a family in the top one percent has a net worth 288 times higher than the typical family, which is a record for this country."

Here is a factual error, marred by an analytical error, compounded by a moral error. It's the top 20% that take in just over half of aggregate income, according to the Census Bureau, not the top 10%. That figure is essentially unchanged since the mid-1990s, when Bill Clinton was president. And it isn't dramatically different from 1979, when the top fifth took in 44% of aggregate income.

Stephens would have done well to check Obama's sources before trumpeting the superiority of his own numbers. Paul Krugman gives the following explanation on his blog:

What’s going on here? Stephens is citing the Census data, which everyone who knows anything about inequality knows has a problem with very high incomes thanks to “top-coding”. The Piketty-Saez data, which use tax returns to estimate income shares, do indeed show the top 10 percent receiving half the income, up from 42 percent in 1995. Maybe you don’t like those estimates, but Obama made no mistake – while Stephens did.

An article titled "Recent Census Data Significantly Understate The Increase in Income Disparities" explains this in more detail:

In contrast, the Census data are based upon a voluntary population-based survey. They cover virtually the entire population. However, the standard data on income that the Census Bureau publishes do not include capital gains income, which is a large source of income for high-income individuals. The Census Bureau also places an upper limit on the amount of certain types of income it counts for any individual, disregarding income above these amounts; this is done for confidentiality and other reasons. For example, the highest salary that can be recorded is $999,999. Anyone with a salary above this amount is recorded as having a salary of $999,999. As a result of these and other factors, the Census data significantly understate the income of those at the top of the income spectrum as well as recent increases in income among this group.

In fact, Table A3 of a spreadsheet on the Piketty-Saez site shows the income share of the top 10 percent to have risen from 34.21% in 1979 to 50.42% in 2012. Hence, Obama's statement that "The top 10 percent no longer takes in one-third of our income—it now takes half" was correct.

Despite Krugman's contention that "everyone who knows anything about inequality knows [the Census data] has a problem with very high incomes", this error might be understandable. However, Stephens then goes on to make an error that is just astonishing. He continues:

Besides which, so what? In 1979 the mean household income of the bottom 20% was $4,006. By 2012, it was $11,490. That's an increase of 186%. For the middle class, the increase was 211%. For the top fifth it's 320%. The richer have outpaced the poorer in growing their incomes, just as runners will outpace joggers who will, in turn, outpace walkers. But, as James Taylor might say, the walking man walks.

Stephens appears to be using the Census data from this spreadsheet of Table H-3 on the Census website as it exactly matches his numbers. The following numbers are from that spreadsheet:

Table H-3.  Mean Household Income Received by Each Fifth and Top 5 Percent
            (in current and 2012 CPI-U-RS adjusted dollars)

           Lowest   Second    Third   Fourth  Highest    Top 5
    Year    fifth    fifth    fifth    fifth    fifth  percent
-------- -------- -------- -------- -------- -------- --------
Current Dollars
    1979    4,006    9,964   16,428   24,108   43,265   65,984
    2012   11,490   29,696   51,179   82,098  181,905  318,052

% Change    186.8    198.0    211.5    240.5    320.4    382.0

           Lowest   Second    Third   Fourth  Highest    Top 5    Top 5
    Year    fifth    fifth    fifth    fifth    fifth  percent  percent*
-------- -------- -------- -------- -------- -------- -------- --------
2012 Dollars
   1979    11,808   29,369   48,422   71,060  127,526  194,491  214,767
   2012    11,490   29,696   51,179   82,098  181,905  318,052  433,937

% Change     -2.7      1.1      5.7     15.5     42.6     63.5    102.0

Source: U.S Census Bureau, Table H-3 (except last column)

* last column from Piketty-Saez, Table A6
As can be seen, the spreadsheet gives the incomes in "current dollars" and in "2012 dollars". The latter measure adjusts the incomes for inflation, converting all of the numbers to "2012 dollars". The former measure (current or nominal dollars) is NOT corrected for inflation. This is the measure that Stephens saw fit to use. If one uses the figures that are corrected for inflation, however, the incomes of the lowest fifth actually went down 2.7 percent from 1979 to 2012, not up by 186% as Stephens contends.

Regarding Stephens' choice of non-inflation-corrected numbers, Miles Kimball, Professor of Economics and Survey Research at the University of Michigan, writes the following:

It is hard to read the 186% figure in this passage in any way that is not egregiously misleading. The gist of the argument is that a rising tide is lifting all boats, so that the passage seems to suggest that the bottom 20% have been lifted by 186%. Even on the editorial page, the Wall Street Journal’s journalistic standards should be higher.

Correcting dollar figures for inflation is a concept so basic that it is likely known by every living economist. In fact, it is likely known by the great majority of living adults. How could Stephens and the editorial board at the Wall Street Journal have missed it? As Kimball says, it's hard not to read this as "egregiously misleading". It will be interesting to see if Stephens or the Wall Street Journal publish a correction to this egregious mistake. That might give some indication as to whether they are concerned about their reputations or are simply pushing a point of view by whatever means possible.

Do Publications Have Any Responsibility to Screen Their Editorials? (Part 2)

About Me

I became interested in U.S. budget and economic matters back in 1992, the first time that I remember the debt becoming a major issue in a presidential election. Along with this blog, I have a website on the subject at http://www.econdataus.com/budget.html. I have blogged further about my motivations for creating this blog and website at this link. Recently, I've been working on replicating studies such as the analysis at this link.

Contact Form

Name

Email *

Message *