The problem with this comparison is that the figures are not corrected for inflation or the growth in California's population. In fact, the article states the following in a later paragraph:
If California had simply limited its spending increases to the 4.38 percent average increase in the state's consumer price index and population growth each year since FY 1990-91, the California would be sitting on a $15 billion surplus right now.
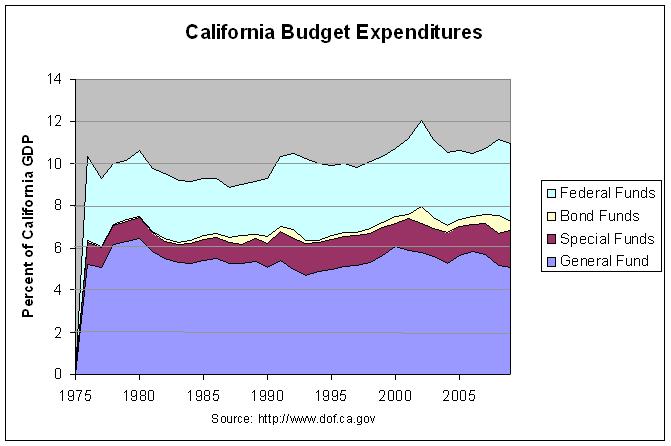
Hence, the article seems to admit that this a more valid way to compare the figures. Another commonly used method to compare revenue and spending figures is to take their values as a percentage of the economy and compare those. This is reasonable in that revenues tend to generally grow in line with the economy from which they are drawn. The following graph shows California budget expenditures as a percentage of the California gross domestic product.

The actual numbers and sources for this and the following graph can be found at the aforementioned link. The numbers do show that expenditures (excluding federal funds) rose from a low of 6.33% of state GDP in 1994 to a high of 7.97% of state GDP in 2002. In retrospect, it would have been wise to restrain this increase. Still, the graph shows that there has not been the runaway increase in spending that many have described. In addition, there may be a reasonable explanation for the slight increase in spending. Following is a paragraph from a May 8th editorial in the Los Angeles Times that addresses this issue:
While spending has increased over time, the growth in spending reflects demands imposed by a population that is growing, aging and becoming more diverse. In the last year alone, California has added more than 408,000 new residents, nearly equal to the population of Sacramento. And, critically important from a budgetary standpoint, the fastest-growing segment of the population is the elderly, increasing demands on health and age-dependent services. About 60% of the nursing home days in California, for example, are paid for by Medi-Cal, the publicly supported health program for low-income Californians.
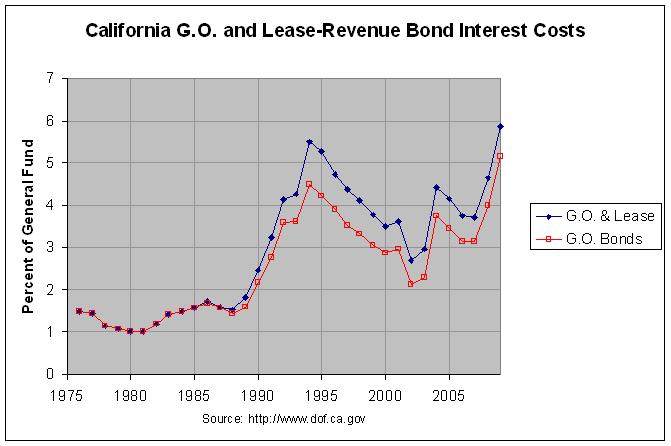
The problem of increased entitlement spending as the population ages is likewise a national problem. Another shared problem is shown in the following graph:

The graph shows that the interest costs on general obligation and lease-revenue bonds are projected to hit a new 30-year high. Hence, the cost of servicing its debt is a growing concern for California just as it arguably is for the nation as a whole.