Saturday, February 23, 2008

Long-run Budget Projections

As stated in my prior post, the gross federal debt may give a better indication of our pending liabilities than the debt held by the public. To be more precise, however, the gross federal debt includes the debts that are currently owed to trust funds which will help deal with those liabilities. It gives no indication of liabilities that are not covered by those debts. For example, the following table can be found on page 8 of the Summary of the 2007 Annual Social Security and Medicare Trust Fund Reports:

KEY DATES FOR THE TRUST FUNDS

OASI DI OASDI HI
----- ----- ----- -----
First year outgo exceeds income
excluding interest................ 2018 2005 2017 2007
First year outgo exceeds income
including interest................ 2028 2013 2027 2011

Year trust fund assets are exhausted 2042 2026 2041 2019

OASI refers to the Old-Age and Survivors Insurance Trust Fund, DI refers to the Disability Insurance Trust Fund, and OASDI refers to the combination of those two funds. Finally, HI refers to the Medicare Hospital Insurance Trust Fund, also referred to as Medicare Part A. As can be seen, the OASDI and HI trust funds are projected to run out of funds in 2041 and 2019, respectively. This is reflected in the following graph which is based on long-run budget projections from page 188 of the Analytical Perspectives in the recently-released budget:
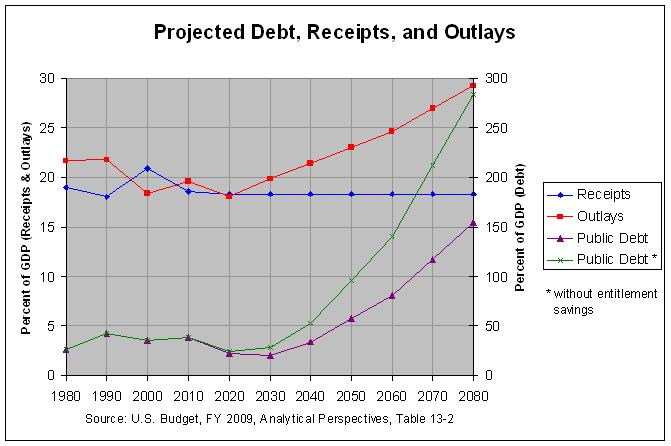


The actual numbers and sources are at http://www.econdataus.com/pro2009.html. As can be seen, the debt held by the public is projected to reach 154.4% of GDP by 2080 if entitlement savings proposed in the just-release budget are implemented. This far surpasses the prior high of 108.6% of GDP reached at the end of the Second World War. If the proposed entitlement savings are not implemented, the debt held by the public is projected to reach a much higher 283.4% of GDP by 2080.


It is important to note these are projections, not predictions. The current law on which these projections are based would very likely have to change before the debt could reach such historic levels. Still, just as the gross federal debt measures some information that is missed by the debt held by the public, so do these projections measure some information that is missed by the gross federal debt. It is worth looking at all of these measures in trying to judge the financial condition of the federal government.
Tuesday, February 19, 2008

Debt outlook

Regardless of the significance of the deficit, the federal debt is arguably more critical. Afterall, it is the debt, not the deficit, that we are paying interest on every year. The following graph shows selected measures of the U.S. deficit according to the just-released budget:


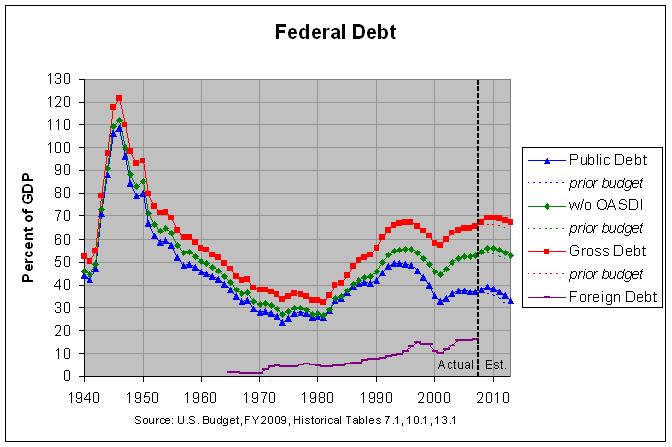
The red line is the "gross federal debt" and the blue line is the "debt held by the public". These debts are currently about 9.3 trillion dollars and 5.2 trillion dollars, respectively, and are related in that the gross federal debt is equal to the debt held by the public plus "intragovernmental holdings". This intragovernmental debt is chiefly held by trust funds with a bit more than half of it being held by the Social Security trust fund. A list of these trust funds, along with the actual numbers and sources for the graph above can be found at http://www.econdataus.com/debt09.html.


There is some dispute about whether the gross federal debt or the debt held by the public are better measures of the nation's fiscal health. Pages 230 and 231 of the Analytical Perspectives in the just-released budget compares the two debts and gives the following conclusion:


For all these reasons, debt held by the public is a better gauge of the effect of the budget on the credit markets than gross Federal debt.


Page 16 of the chapter titled "The Nation's Fiscal Outlook" in the budget states the following:


To understand the Nation’s fiscal outlook, it is helpful to consider both the budget deficit and the amount of debt held by the public. Debt held by the public reflects the amount of money that the Government has borrowed from outside the Government to finance current and past deficits. Debt held by the public has ranged from 33 to 49 percent of GDP over the past 20 years and averaged 35.6 percent over the past 40 years. At the end of 2007, debt held by the public was $5.035 trillion, or 36.8 percent of GDP, falling from 37.1 percent in 2006. For 2012, debt held by the public is projected to be 35.1 percent, below the long-term historical average. Declining deficits and reductions in the debt held by the public demonstrate that the President’s pro-growth policies, coupled with spending restraint, are working to improve the Nation’s fiscal outlook.


A search of this chapter shows that it does not even mention the gross federal debt. In any event, it does seem that the debt held by the public does not tell the whole story about the nation's fiscal outlook. If the Baby Boomers were just now entering the workforce rather than starting to retire, our fiscal outlook would arguably be much better. Hence, the gross federal debt may give a better indication (though an imperfect one) of our pending liabilities. As can be seen, it is projected to peak at 69.4 percent of GDP in 2010, its highest level since 1955.


Long-run Budget Projections

Saturday, February 16, 2008

Deficit outlook worsens

President Bush's 2009 Budget was released on Monday, February 4th. The following graph shows selected measures of the U.S. deficit according to that budget:


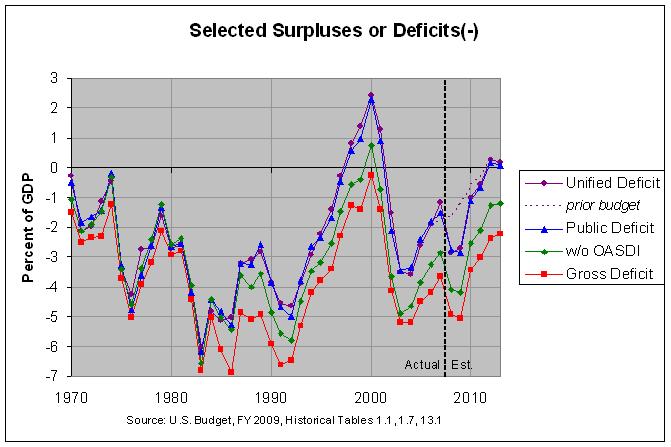
The most commonly discussed measure of the deficit is the unified deficit, shown in purple. The graph shows the actual values of the unified deficit through 2007 and projected values from 2008 forward. In addition, the dotted purple line shows the projected values of the unified deficit from last year's budget. The actual numbers and sources can be found at http://www.econdataus.com/def09.html.


As can be seen, the unified deficit for 2007 is $82 billion less than was projected in the prior budget. However, the outlook for the next two years has greatly worsened. The prior budget projected that the deficit would gradually decline, reaching a small surplus of $61 billion in 2012. It is now projected to worsen by over $200 billion per year for the next two years and then decline rapidly, still reaching a small surplus (of $48 billion) in 2012. However, due to the high deficits of the next two years, the gross federal debt is projected to be $381 billion greater in 2012 than was projected in the prior budget.


Regarding the worsening deficit over the next two years, following is an excerpt from page 16 of the budget:


The 2008 deficit is projected to be $410 billion, or 2.9 percent of GDP, and the 2009 deficit is projected to be $407 billion, or 2.7 percent of GDP. The primary reason for increasing deficits in the near term is the President’s economic growth package and an expected slowing of receipt growth, due to an expected reduction in corporate tax receipts from recent high levels. Another reason for increases in the projected near-term deficits is increasing defense and emergency spending.


Debt outlook


Long-run Budget Projections

Welcome

This blog is connected with the web site at http://www.econdataus.com/budget.html. The main purpose of that web site is to organize and present budget and economic data and provide their sources. The purpose of this blog will be to add some commentary and perhaps to promote some discussion of that data.

About Me

I became interested in U.S. budget and economic matters back in 1992, the first time that I remember the debt becoming a major issue in a presidential election. Along with this blog, I have a website on the subject at http://www.econdataus.com/budget.html. I have blogged further about my motivations for creating this blog and website at this link. Recently, I've been working on replicating studies such as the analysis at this link.

Contact Form

Name

Email *

Message *