Note: An updated version of the following post can be found at this link.
Each month, the Treasury Department posts updated estimates of the foreign holdings of U.S Treasuries by country at this link. It also posts estimates going back to March 2000 at this link. The following graph shows the totals for all countries by the type of treasury security and the totals for the three countries with the largest holdings.
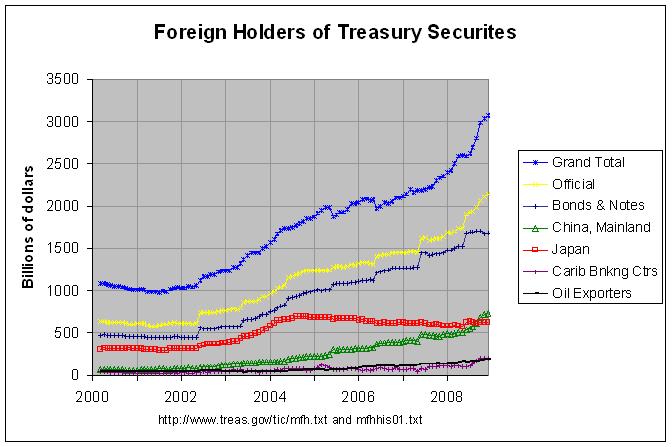
The purple line shows the grand total of all treasury securities held by all foreign countries, private and public. As can be seen, it has been increasing steadily since early 2002 and has accelerated somewhat in the past year. The yellow line shows those securities held by "official institutions", defined on page 7 of the Report on U.S. Portfolio Holdings of Foreign Securities at End-Year 2004 as follows:
Official institutions consist primarily of national government and multinational institutions involved in the formulation of international monetary policy, but also include national government-sponsored investment funds and other national government institutions. Data on such institutions are collected separately because the motivations behind holdings of official institutions may differ from those of other investors.
The dark blue line just below the yellow line shows the totals for bonds and notes which are that portion of the total securities that are long-term debt securities, with an original
maturity of over one year. More details on short-term and long-term debt securities can be found on page 7 of the Report on U.S. Portfolio Holdings of Foreign Securities at End-Year 2007.
The other three lines show the holdings of the three countries with the largest holdings. These can be seen in more detail in the following graph which shows the holdings of the eight countries with the largest holdings:
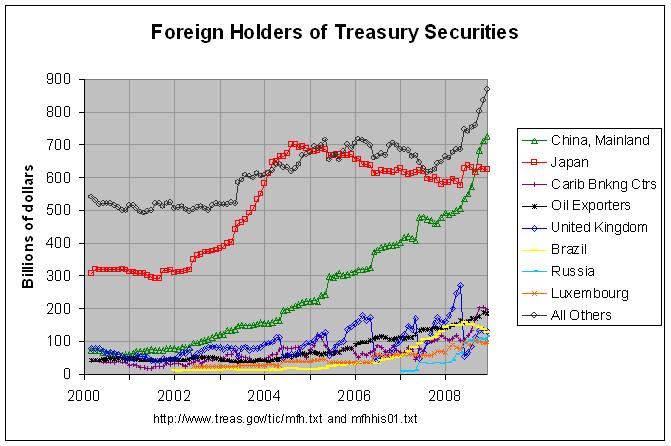
The actual numbers and sources for both of the above graphs can be found at this link. As can be seen, the holdings of Mainland China has risen steadily since early 2002, increasing about seven-fold from $76.5 billion in February of 2002 to $541 billion now. It appears that they are just about to pass up Japan as the largest foreign holder of Treasuries. In fact, Japan's holdings reached a maximum of $699.4 billion in August of 2005 and have fallen to $585.9 billion now. Also, I noticed a few other interesting things in the data. The United Kingdom's holdings have soared from $50 billion in June of 2007 to $307.4 billion now. However, there seems to be a large discontinuity between each annual survey for the United Kingdom causing a large saw-tooth effect in the graph. If anyone knows the reason for this, please leave a comment.
In any case, there are a number of other countries whose holdings have increased rapidly for some portion of the past eight years. The holding of Oil Exporters have more than quadrupled from $43.9 billion in January of 2004 to $179.8 billion now. The holdings of Brazil have gone up by a factor of ten from $14 billion in January of 2005 to $146.2 billion now. The most recent rapid increase has been in the holdings of Russia which has gone up by a factor of ten from $7.4 billion in March of 2007 to $74.4 billion now. I would guess that most of this investment from Oil Exporters, Brazil, and Russia came from income from resources, chiefly oil. With oil having fallen from a high of $147 per barrel last July to below $56 a barrel now, it would seem likely that future investment in Treasuries by these nations will fall. In addition, it would seem possible that China's future investment will fall due to its recently reported plan to implement a stimulus program of over a half-trillion dollars.
This does seem worrisome. I'm not an expert on the auction of Treasuries but it would seem that there is at least a risk of a significant rise in the interest rate that we have to pay on Treasuries. Due to the current flight to safety and strength in the dollar, this may not occur immediately. But it would seem to be a serious risk in the future. That risk is mentioned in this article.
This is all the more a concern because most of the increase in the public debt has been financed by foreign investors in recent years. From 2001 to 2007, the total public debt increased $1.716 trillion and the foreign-held public debt increased $1.235 trillion (see here). Hence, in effect, about 72 percent of the total increase in the public debt since 2001 has been borrowed from foreign sources.
