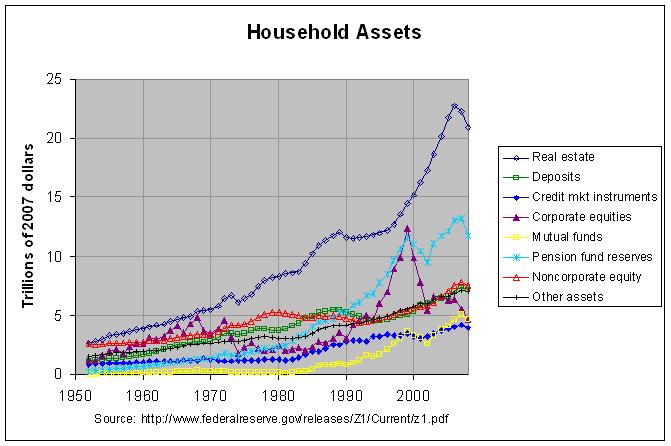
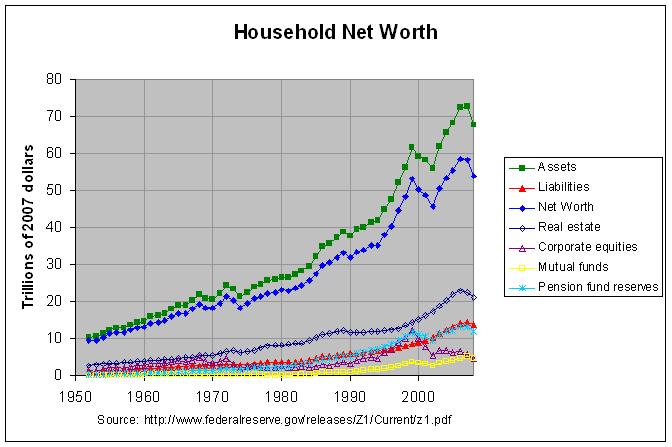
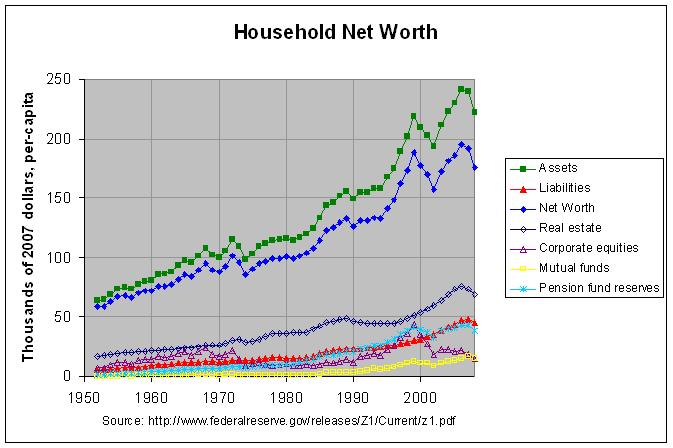
My prior post looked at household assets, liabilities, and net worth as given by the Federal Reserve's Quarterly Release Z.1, "Flow of Funds Accounts of the United States". While this report gives a good overview of household net worth in the United States, it gives no information about the distribution of that net worth. The only regular study of that distribution that I'm aware of is the Federal Reserve's Survey of Consumer Finances which is conducted every three years. The last one for which data has been released was in 2004. Data from the 2007 Survey of Consumer Finances is expected to be released in the first quarter of 2009.
Table 3 of the 2004 Survey of Consumer Finances gives family net worth, by selected characteristics of families, from the past six surveys (1989 through 2004). It gives both the mean and the median of the subgroups determined by these characteristics so it's important to understand the difference between these two terms. Briefly, the mean of a series of numbers is the "average", computed by dividing the sum of the numbers by the count of the numbers in the series. The median, on the other hand, is the "middle" value when the numbers are arranged in order of value. If there are an even number of values, it is the average of the two middle values. Hence, the series 1, 2, and 6 has a mean of 3 and a median of 2 and the series 1, 2, 3, and 6 has a mean of 3 and a median of 2.5. Note that in both of these cases, the mean is greater than the median. This is because the relatively high value of the last number in the series (the 6) pulls up the mean more than it does the median. This is important to remember in interpreting the numbers in table 3.
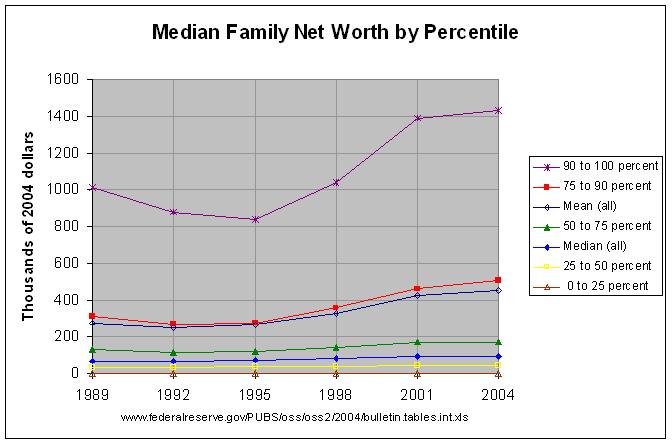
The following graph shows the median family net worth by percentiles of net worth:

The actual numbers and their sources can be found at this link. The above graph also shows the overall mean and median family net worth. Note that the overall mean is much higher than the median and is just below the median of the 75 to 90 percentile. This is due to the fact that, like the example above, the majority of families have a net worth less than the mean. In fact, the above graph would indicate that about 80 percent of families have a net worth that is less than the mean.
One useful thing about looking at the medians of percentiles is that the median represents the central percent of the percentile. That is, the medians of the 0 to 25, 25 to 50, 50 to 75, 75 to 90, and 90 to 100 percentiles represent the 12.5, 37.5, 62.5, 82.5, and 95 percentiles, respectively. That is because percentiles, like medians, are obtained by arranging the series by order of value. Hence, the data shows that 50 percent of families had a net worth less than $93,100 in 2004 and three-quarters of those families (37.5 percent of all families) had a net worth less than $43,600. This data shows that net worth is strongly skewed toward the bottom of the entire range of net worths held by families.
A very close look at the data shows that the mean surpasses the median only slightly in the 25 to 50, 50 to 75, and 75 to 90 percentiles. In the 0 to 25 percentile, the median actually surpassed the mean. Only in the 90 to 100 percentile does the mean greatly surpass the median. This suggests that the majority of the skewing of all of the data is due to the relatively high net worth of those in the 90 to 100 percentile, especially those in the upper portion of this range.


