Distribution of Family Net Worth (Part 2)
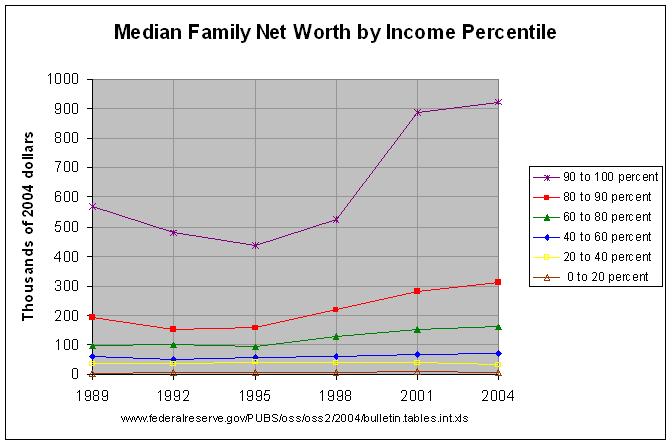
The actual numbers and their sources can be found at this link. As can be seen, there is a positive correlation between net worth and income. That is, those with higher income tend to have a higher net worth. The data also shows that the median net worth of the top ten percent of income earners more than doubled from 1995 to 2004. The median net worth of the 80 to 90 percentile nearly doubled and the net worth of the 60 to 80 percentile went up about 71 percent during that period. The median net worth of the other 60 percent of income earners gained much less with the net worth of the 20 to 40 percentile actually decreasing by over 18 percent.
The following graph looks at family net worth by the age in years of the family head:
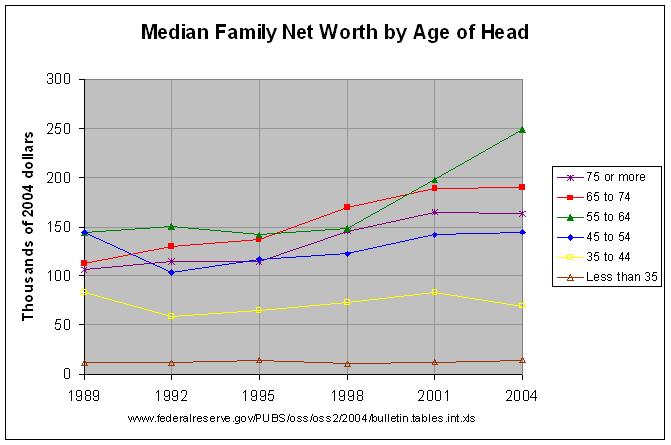
As before, the actual numbers and their sources can be found at this link. The graph shows that the median net worth is relatively low for families whose head is under 35 but grows steadily until the head is 65 years or older. At that point, net worth starts to slowly drop off. However, even the median net worth of families whose head is 75 or more is generally more than it is for families whose head is 45 to 54 years of age. Hence, net worth does not drop off that quickly.
The following graph looks at family net worth by the education level of the family head:
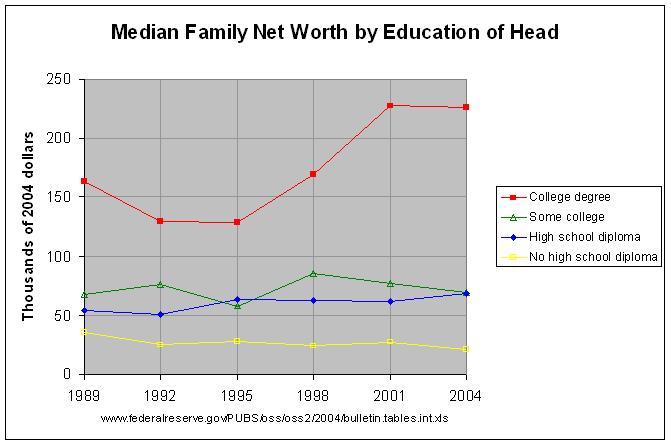
As can be seen, the median net worth of families whose head is a college graduate is much higher than it is for other families. This net worth increased by over 75 percent from 1995 to 2004 while the median net worth of all other families stayed about the same. Still, families whose head had a high-school diploma had a much higher net worth than those who did not. In fact, the median net worth of families whose head did not have a high-school diploma dropped by 42 percent from 1989 to 2004. Hence, it appears that higher education is becoming a more important determinant of a family's net worth.
There are a couple of other interesting facts apparent from the table at this link. One is that the median net worth of white non-hispanic families is far above that of nonwhite or hispanic families. It has narrowed somewhat going from about 10.6 times as large in 1989 to 5.7 times as large in 2004. In addition, the median net worth of nonwhite or hispanic families has increased by about 2.5 times over that period, from about $9.8 thousand in 1989 to $24.8 thousand in 2004. Still, a large differential remains.
The second fact is that home owners have a much higher median net worth than renters. In fact, renters had a lower median net worth than any other group in the table, including nonwhite or hispanic families. That net worth ranged from $2.9 thousand in 1989 to $6 thousand in 1995.


Comments
Post a Comment