Policy makers in Washington and other capitals around the world are debating whether to implement another round of stimulus spending to combat high unemployment and sputtering growth rates. But before they leap, they should take a good hard look at how that worked the first time around.
It worked miserably, as indicated by the table nearby, which shows increases in government spending from 2007 to 2009 and subsequent changes in GDP growth rates. Of the 34 Organization for Economic Cooperation and Development nations, those with the largest spending spurts from 2007 to 2009 saw the least growth in GDP rates before and after the stimulus.
Regarding this nearby table, monetary economist David Glasner says the following in a critique of the Laffer editorial:
So how did Laffer perform his calculation? He doesn’t say. All he does is cite the IMF as the source for his table. Thanks a lot, Art; that was really helpful, but unfortunately, not helpful enough to figure out what you are talking about.
Glasner is referring to the fact that the table gives the source of the data simply as "International Monetary Fund". It does seem that many discussions in the political arena are hamstrung (perhaps purposely) by the failure of the author to give a usable source, much less to explain his calculations. I've therefore taken the time to do what Laffer arguably should have done to begin with. I found this spreadsheet on the IMF site which appears to contain the numbers used by Laffer. The following two tables show how these numbers can be used to calculate Laffers figures:
               Gross domestic product, constant prices
                           Percent change                              (08+09)
                                                                         minus
Country             2006     2007     2008     2009     2010     2011  (06+07)
---------------- ------- -------- -------- -------- -------- -------- --------
United States      2.658    1.913   -0.337   -3.486    3.030    1.735     -8.4
Japan              1.693    2.192   -1.042   -5.527    4.435   -0.748    -10.5
Germany            3.889    3.394    0.809   -5.078    3.562    3.056    -11.6
France             2.658    2.234   -0.196   -2.631    1.382    1.715     -7.7
United Kingdom     2.607    3.466   -1.103   -4.373    2.092    0.655    -11.5
Italy              2.199    1.683   -1.156   -5.494    1.804    0.431    -10.5
Canada             2.823    2.200    0.689   -2.770    3.215    2.460     -7.1
Australia          2.682    4.676    2.500    1.373    2.544    2.035     -3.5
Spain              4.077    3.479    0.888   -3.740   -0.070    0.710    -10.4
Mexico             5.147    3.242    1.186   -6.275    5.543    3.967    -13.5
Korea              5.179    5.106    2.298    0.319    6.320    3.634     -7.7
Turkey             6.893    4.669    0.659   -4.826    9.006    8.460    -15.7
Netherlands        3.394    3.921    1.804   -3.479    1.633    1.266     -9.0
Switzerland        3.630    3.645    2.095   -1.878    2.714    1.851     -7.1
Sweden             4.557    3.431   -0.774   -4.845    5.845    3.991    -13.6
Poland             6.227    6.785    5.127    1.606    3.944    4.350     -6.3
Norway             2.443    2.652    0.009   -1.661    0.654    1.688     -6.7
Belgium            2.702    2.900    0.957   -2.841    2.266    1.893     -7.5
Austria            3.670    3.706    1.396   -3.810    2.315    3.107     -9.8
Denmark            3.395    1.583   -0.784   -5.834    1.296    1.050    -11.6
Chile              5.825    5.207    3.034   -0.860    6.137    5.924     -8.9
Greece             4.614    3.032   -0.137   -3.258   -3.507   -6.860    -11.0
Finland            4.411    5.335    0.294   -8.354    3.732    2.855    -17.8
Israel             5.594    5.497    4.028    0.837    4.846    4.707     -6.2
Portugal           1.448    2.365   -0.008   -2.908    1.383   -1.466     -6.7
Ireland            5.312    5.182   -2.972   -6.995   -0.430    0.705    -20.5
Czech Republic     7.020    5.735    3.099   -4.695    2.739    1.655    -14.4
New Zealand        0.997    2.840   -0.074   -2.071    1.215    1.441     -6.0
Hungary            3.900    0.100    0.900   -6.800    1.270    1.695     -9.9
Slovak Republic    8.345   10.494    5.751   -4.932    4.183    3.349    -18.0
Luxembourg         4.969    6.639    0.754   -5.300    2.678    1.004    -16.2
Slovenia           5.850    6.870    3.589   -8.008    1.380   -0.175    -17.1
Estonia           10.097    7.492   -3.671  -14.258    2.264    7.636    -35.5
Iceland            4.709    5.985    1.270   -6.807   -4.024    3.051    -16.2

                General government total expenditure
                           Percent of GDP                                 2009
                                                                         minus
Country             2006     2007     2008     2009     2010     2011     2007
---------------- ------- -------- -------- -------- -------- -------- --------
United States     35.852   36.672   39.196   43.981   42.142   41.397      7.3
Japan             34.489   33.312   35.730   39.982   39.002   40.675      6.7
Germany           45.559   43.506   44.046   48.104   47.869   45.625      4.6
France            52.934   52.595   53.329   56.725   56.668   56.321      4.1
United Kingdom    40.613   40.325   43.066   47.267   46.325   45.725      6.9
Italy             48.464   47.611   48.610   51.889   50.495   49.953      4.3
Canada            39.268   39.158   39.535   44.056   43.815   42.664      4.9
Australia         34.635   34.244   34.487   37.579   36.773   36.598      3.3
Spain             38.342   39.192   41.300   46.065   45.439   43.586      6.9
Mexico            22.818   23.148   24.606   28.314   26.928   26.211      5.2
Korea             21.535   21.886   22.387   23.030   20.999   21.658      1.1
Turkey            32.793   33.325   33.837   37.717   35.443   34.186      4.4
Netherlands       45.687   45.087   46.116   50.785   50.614   50.034      5.7
Switzerland       35.663   34.634   32.612   34.398   34.040   34.736     -0.2
Sweden            50.770   48.968   49.625   52.793   50.634   49.126      3.8
Poland            43.864   42.187   43.194   44.510   45.366   44.472      2.3
Norway            39.936   40.386   39.764   46.610   45.421   44.320      6.2
Belgium           48.603   48.320   49.900   53.828   52.942   53.450      5.5
Austria           49.141   48.602   49.335   52.893   52.603   50.449      4.3
Denmark           51.250   50.788   51.424   57.899   56.174   55.972      7.1
Chile             18.716   19.381   21.727   24.622   23.628   23.300      5.2
Greece            44.691   46.709   49.734   53.033   49.620   49.696      6.3
Finland           49.238   47.431   49.316   56.103   55.550   54.043      8.7
Israel            47.501   46.016   45.427   45.086   44.736   44.354     -0.9
Portugal          44.364   44.362   44.816   49.914   51.414   48.710      5.6
Ireland           33.406   36.194   42.301   47.937   65.637   44.143     11.7
Czech Republic    41.967   41.040   41.148   44.921   44.110   44.549      3.9
New Zealand       31.105   31.064   32.862   34.471   34.490   35.364      3.4
Hungary           52.164   50.641   49.205   51.380   49.453   48.441      0.7
Slovak Republic   36.521   34.210   35.049   41.704   41.100   38.375      7.5
Luxembourg        38.576   36.267   37.103   43.042   42.482   41.635      6.8
Slovenia          42.547   40.262   41.422   46.355   47.134   47.713      6.1
Estonia           34.573   34.853   41.037   47.654   44.713   43.123     12.8
Iceland           41.641   42.268   44.639   49.672   47.923   46.321      7.4
The numbers in the rightmost column of both tables exactly match the numbers in Laffer's table. Hence, first table shows that the change in real GDP growth in Laffer's table is equal to the annual GDP changes in 2008 and 2009 minus the annual GDP changes in 2006 and 2007. The second table shows that the change in government spending in Laffer's table is equal to the government spending in 2009 minus the government spending in 2007, both numbers taken as a percent of GDP.
Based on these numbers, Laffers editorial continues as follows:
The four nations—Estonia, Ireland, the Slovak Republic and Finland—with the biggest stimulus programs had the steepest declines in growth. The United States was no different, with greater spending (up 7.3%) followed by far lower growth rates (down 8.4%).
This statement is based on Laffer's calculations for these four nations, shown in bold in the rightmost column of the above tables. Regarding Laffer's calculation of public spending as a percent of GDP, economist Lars Christensen says the following in another critique of the Laffer editorial:
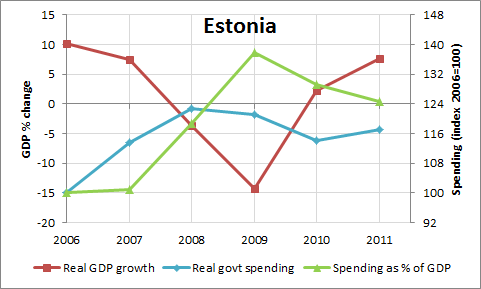
One major problem with Laffer’s numbers is that he is using public spending as share of GDP to analyze the magnitude of change in fiscal policy. However, for a given level of public spending in euro (the currency today in Estonia) a drop in nominal GDP will naturally lead to an increase in public spending as share of GDP. This is obviously not fiscal stimulus. Instead it makes more sense to look at the level of public spending adjusted for inflation and this is exactly what I have done in the graph below. I also plot Estonian GDP growth in the graph. The data is yearly data and the source is IMF.
Following is a similar graph, also showing public spending adjusted for inflation (blue line) and GDP growth (red line) for Estonia. It also shows public spending as a percentage of GDP (green line), the spending values used by Laffer.
The following table shows the values for real public spending as calculated from the IMF data:
                General government total expenditure
             Constant national currency* (index 2006=100)                 2009
                                                                         minus
Country             2006     2007     2008     2009     2010     2011     2007
---------------- ------- -------- -------- -------- -------- -------- --------
United States      100.0    104.3    109.4    120.1    118.0    116.7     15.8
Japan              100.0     97.7    101.0    107.7    108.2    110.1     10.0
Germany            100.0     98.0     98.3    102.9    105.6    101.9      4.9
France             100.0    102.6    103.2    107.2    107.6    108.0      4.7
United Kingdom     100.0    102.7    107.9    112.7    112.3    109.3     10.1
Italy              100.0    100.2    100.2    102.4    100.2     98.0      2.2
Canada             100.0    103.0    106.4    112.8    117.1    117.2      9.8
Australia          100.0    105.5    111.3    121.1    124.5    127.6     15.6
Spain              100.0    106.2    111.0    119.6    116.0    110.2     13.4
Mexico             100.0    106.4    115.8    123.8    124.2    128.2     17.4
Korea              100.0    106.3    109.4    113.6    110.9    115.9      7.3
Turkey             100.0    103.9    107.7    113.2    113.5    121.5      9.3
Netherlands        100.0    102.8    107.0    112.2    114.0    112.9      9.3
Switzerland        100.0    102.4     98.5    102.6    103.6    108.2      0.1
Sweden             100.0    100.7    101.3    102.4    103.3    103.8      1.7
Poland             100.0    104.2    110.9    116.4    121.9    123.3     12.2
Norway             100.0    106.2    111.8    118.1    120.3    124.5     11.9
Belgium            100.0    102.8    104.8    111.2    111.3    113.0      8.4
Austria            100.0    102.4    103.9    107.8    109.8    107.0      5.4
Denmark            100.0    101.2    102.5    108.4    108.1    106.9      7.1
Chile              100.0    109.3    116.9    134.6    145.3    151.1     25.3
Greece             100.0    109.1    116.2    121.3    106.2     97.6     12.3
Finland            100.0    102.9    106.3    110.5    112.1    112.5      7.7
Israel             100.0    102.1    101.5    103.3    105.9    108.5      1.2
Portugal           100.0    102.8    102.7    113.1    117.7    107.1     10.4
Ireland            100.0    112.2    120.6    124.0    167.5    111.7     11.7
Czech Republic     100.0    103.9    102.9    108.0    105.6    105.5      4.2
New Zealand        100.0    104.9    110.0    114.0    117.2    121.1      9.1
Hungary            100.0     94.9     92.4     89.4     85.6     85.0     -5.6
Slovak Republic    100.0    102.7    110.1    122.0    125.0    117.8     19.3
Luxembourg         100.0    101.6    105.7    115.8    120.4    118.9     14.3
Slovenia           100.0    101.7    106.8    112.2    112.4    112.4     10.6
Estonia            100.0    113.5    122.8    121.2    114.2    117.0      7.7
Iceland            100.0    108.2    115.2    115.4    108.4    107.1      7.2
A careful comparison of Christensen's graph and the graph above shows that real public spending (blue line) increases slightly faster on the former, reaching about 122 in 2011 versus 117 in the latter. This is likely because the graph above is using "Inflation, average consumer prices" as given in the IMF data whereas Christensen's data is likely using an alternate measure of inflation. However, the shapes of the line are basically the same and Christensen's following statement holds true for both:
So what happened in 2009? Inflation adjusted public spending dropped! This is what makes Estonia unique. The Estonian government did NOT implement Keynesian policies rather it did the opposite. It cut spending. This is clear from the graph (the blue line). It is also clear from the graph that the Estonian government introduced further austerity measures and cut public spending further in 2010. This is of course what Laffer calls “fiscal stimulus”.
In fact, the four countries with the most fiscal stimulus as measured by the real increase in public spending from 2007 to 2009 were Chile (25.3), the Slovak Republic (19.3), Mexico (17.4), and the United States (15.8)! That includes only one of Laffer's choice of 4 countries with the least growth in GDP rates. The other three had much lower increases in public spending of 11.7 (Ireland) and 7.7 (Estonia and Finland).
In summary, Laffer makes a number of mistakes in his editorial. The first is to compare growth in GDP rates with government spending as a percent of GDP. He is testing for a relationship between two variables but expressing one of them (spending) in terms of the other (GDP). That is, he is linking them by design! As an example of this link, suppose that spending remains constant but GDP drops. By simple arithmetic, this will cause spending as a percentage of GDP to rise and be interpreted by Laffer as stimulus. This seems like an incredibly elementary mistake for a professional economist to be making.
The second mistake is to select one span of data and look at only that data. Laffer chooses to look at GDP growth from 2006 to 2009 and government spending from 2007 to 2009. The tables at this link show calculation for these same variables going out to 2011 instead of 2009. As can be seen, this causes the results to be very different. For example, the 4 nations with the highest drop in GDP growth rates are Slovenia (-23.1), the Slovak Republic (-22.0), Greece (-21.1), and Iceland (-19.7) if the span is increased from 2009 to 2011.
It's often a good idea to look at all of the available data in graphical format (such as the one above) to get a look over all possible time spans. Similar graphs for Finland, Ireland, and the Slovak Republic can be found at the aforementioned link.
Finally, Laffer makes the mistake of not giving a precise source that allows his calculations to be checked. This may be as much of a mistake of the Wall Street Journal as it is for Laffer. I believe that all publications should mandate that precise sources be given and, if possible, links be provided to background material that explains the author's calculations. Then, others will be able to check the author's work, especially in the case where the publications chooses not to do so or does a poor job of doing so.
Note: There is a discussion of this post at this link.