Distribution of Family Net Worth and its Change in the Economic Crisis
On June, 11th, the New York Times published a story on the just-released Survey of Consumer Finances (SCF) titled "Family Net Worth Drops to Level of Early ’90s, Fed Says". The SCF is a cross-sectional survey of U.S. families which has been done every three years since 1989 and includes information on families’ balance sheets, pensions, income, and demographic characteristics. The New York Times story begins:
The recent economic crisis left the median American family in 2010 with no more wealth than in the early 1990s, erasing almost two decades of accumulated prosperity, the Federal Reserve said Monday.
A hypothetical family richer than half the nation’s families and poorer than the other half had a net worth of $77,300 in 2010, compared with $126,400 in 2007, the Fed said. The crash of housing prices directly accounted for three-quarters of the loss.
The tables at this link are taken from the SCF and show that these numbers are in constant 2010 dollars. The following graph shows these inflation-corrected numbers since 1989:
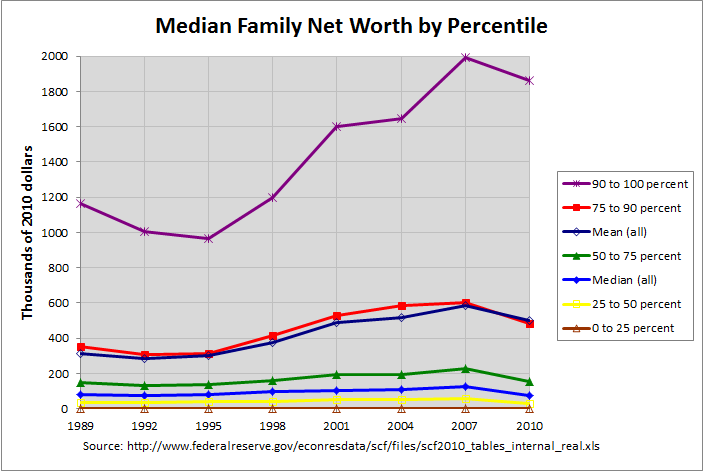
As can be seen, the top 10 percent has such a high relative net worth that the changes in the lower percentiles are difficult to discern. Hence, following is the same graph but going only up to a net worth of 240 thousand dollars:
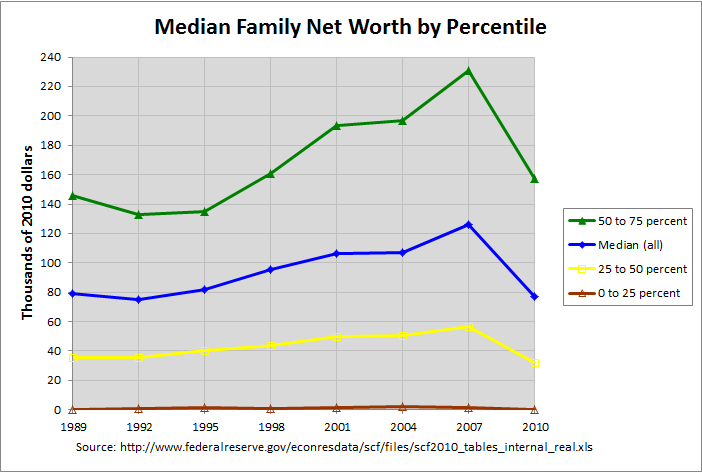
As can be seen, median family net worth in 2010 was just about where it was in 1992, 18 years earlier. Hence, the economic crisis did erase "almost two decades of accumulated prosperity" as stated in the article for the median family. For the mean family, however, it just erased almost one decade of accumulated prosperity.
Table 4 of the 2010 SCF (from whence this data came) gives family net worth, by selected characteristics of families, from the past eight surveys (1989 through 2010). It gives both the mean and the median of the subgroups determined by these characteristics so it's important to understand the difference between these two terms. Briefly, the mean of a series of numbers is the "average", computed by dividing the sum of the numbers by the count of the numbers in the series. The median, on the other hand, is the "middle" value when the numbers are arranged in order of value. If there are an even number of values, it is the average of the two middle values. Hence, the series 1, 2, and 6 has a mean of 3 (9 divided by 3) and a median of 2 and the series 1, 2, 3, and 6 has a mean of 3 (12 divided by 4) and a median of 2.5. Note that in both of these cases, the mean is greater than the median. This is because the relatively high value of the last number in the series (the 6) pulls up the mean more than it does the median. This is important to remember in interpreting the numbers in table 4.
The first graph above shows the overall mean and median family net worth. Note that the overall mean is much higher than the median and is just below the median of the 75 to 90 percentile. This is due to the fact that, like the example above, the majority of families have a net worth less than the mean. In fact, the above graph would indicate that about 80 percent of families have a net worth that is less than the mean.
One useful thing about looking at the medians of percentiles is that the median represents the central percent of the percentile. That is, the medians of the 0 to 25, 25 to 50, 50 to 75, 75 to 90, and 90 to 100 percentiles represent the 12.5, 37.5, 62.5, 82.5, and 95 percentiles, respectively. That is because percentiles, like medians, are obtained by arranging the series by order of value. Hence, the data shows that 50 percent of families had a net worth less than $77,300 in 2010 and three-quarters of those families (37.5 percent of all families) had a net worth less than $32,200. This and the other data shown in the graphs above show that net worth is strongly skewed toward the upper percentiles.
The following table gives the data in the above graphs as displayed from the tables at this link:
   MEDIAN FAMILY NET WORTH, BY SELECTED CHARACTERISTICS OF FAMILIES, 1989-2010 SURVEYS
                              (thousands of 2010 dollars)                               percent
                                                                                         change
Family Characteristics     1989    1992    1995    1998    2001    2004    2007    2010   07-10
-----------------------  ------  ------  ------  ------  ------  ------  ------  ------  ------
Percentile of net worth
Less than 25                0.3     0.8     1.3     0.7     1.4     2.0     1.3     0.0  -100.0
25-49.9                    35.5    35.8    40.0    43.6    50.1    50.2    56.8    32.2   -43.3
Median for All Families    79.1    75.1    81.9    95.6   106.1   107.2   126.4    77.3   -38.8
50-74.9                   146.1   132.8   134.7   160.7   193.6   196.7   230.8   157.2   -31.9
Mean for All Families     313.6   282.9   300.4   377.3   487.0   517.1   584.6   498.8   -14.7
75-89.9                   354.6   309.4   313.3   413.6   528.0   586.7   601.2   482.7   -19.7
90-100                   1161.3  1007.9   967.8  1195.6  1602.6  1645.5  1991.9  1864.1    -6.4
The last column shows the percent change net worth from 2007 to 2010. As can be seen, the greatest percent loss to net worth was to the lower percentiles. The percent loss to the lowest 25 percent, second 25 percent, third 25 percent, next 15 percent, and top 10 percent were 100, 43.8, 31.9, 19.7, and 6.4 percent, respectively. Hence, the burden of the recent economic crisis weighed most heavily on those with the lowest net worth, at least in percentage terms.
Note: There is a discussion of this post at this link.


Comments
Post a Comment