Deficit outlook worsens

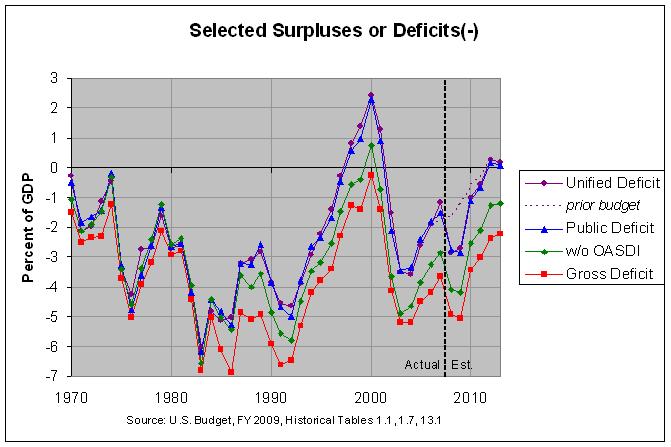
The most commonly discussed measure of the deficit is the unified deficit, shown in purple. The graph shows the actual values of the unified deficit through 2007 and projected values from 2008 forward. In addition, the dotted purple line shows the projected values of the unified deficit from last year's budget. The actual numbers and sources can be found at http://www.econdataus.com/def09.html.
As can be seen, the unified deficit for 2007 is $82 billion less than was projected in the prior budget. However, the outlook for the next two years has greatly worsened. The prior budget projected that the deficit would gradually decline, reaching a small surplus of $61 billion in 2012. It is now projected to worsen by over $200 billion per year for the next two years and then decline rapidly, still reaching a small surplus (of $48 billion) in 2012. However, due to the high deficits of the next two years, the gross federal debt is projected to be $381 billion greater in 2012 than was projected in the prior budget.
Regarding the worsening deficit over the next two years, following is an excerpt from page 16 of the budget:
The 2008 deficit is projected to be $410 billion, or 2.9 percent of GDP, and the 2009 deficit is projected to be $407 billion, or 2.7 percent of GDP. The primary reason for increasing deficits in the near term is the President’s economic growth package and an expected slowing of receipt growth, due to an expected reduction in corporate tax receipts from recent high levels. Another reason for increases in the projected near-term deficits is increasing defense and emergency spending.
Comments
Post a Comment