Is Washington D.C. the Problem?
D.C. residents are enjoying a personal income boom.
The District’s total personal income in 2012 was $47.28 billion, or $74,733 for each of its 632,323 residents, according to the Office of the Chief Financial Officer’s Economic and Revenue Trends report for November.
The U.S. average per capita personal income was $43,725. The highest of the 50 states, Connecticut, fell 25 percent short of D.C.
The article concludes:
The numbers suggest D.C. residents are living the high life. Some are, but, of course, it’s not that simple. Poverty is entrenched in many D.C. neighborhoods, especially east of the Anacostia River, where earnings are virtually nonexistent and the need for social services is dire. But as long as the District is booming on a per capita basis, the money should be available to help.
As it turns out, the $74,733 and $43,725 figures are slightly in error. They come from page 1 of the article's source but on page 17 of that source and on the BEA web site, the numbers are given as $74,773 and $43,735. Still, googing the erroneous numbers turns up a number of articles whose titles suggest conclusions that are less subdued than those drawn by the Business Journal. Just the first page of the google results include Who's Really Making Out Like Bandits in Obama's Economy?, As Unemployed Lose Benefits DC Enjoys A Wonderful Year Of Patronage, Fat City, Living High on the Hog, and It’s a Very Merry Christmas for Washington’s Parasite Class. This last article is by Daniel J. Mitchell of the Cato Institute and is reposted here, here, and here and is referenced on numerous other pages. In it, Mitchell cites the prior figures and states the following:
Why is income so much higher? Well, the lobbyists, politicians, bureaucrats, interest groups, contractors, and other insiders who dominate DC get much higher wages than people elsewhere in the country.
He goes on the reference an article titled Lobbying: A Terrific Investment and, following a link to a Reason TV interview with Andrew Ferguson of the Weekly Standard, he concludes:
I particularly like his common sense explanation that Washington’s wealth comes at the expense of everyone else. The politicians seize our money at the point of a gun (or simply print more of it) to finance an opulent imperial city.
So if you’re having a hard time making ends meet, remember that you should blame the parasite class in Washington.
Is Washington D.C. an "opulent imperial city" that is to blame for some of us "having a hard time making ends meet"? To answer that, it would seem that we need to do more than just compare the per capita personal income of D.C. against that of the entire United States. After all, D.C. is a single city and the U.S. is an entire country. At the very least, it would help to look at other cities. It might also be good to look at entire metropolitan areas so as to capture more of the people who are working in the city or as lobbyists and contractors to the government.
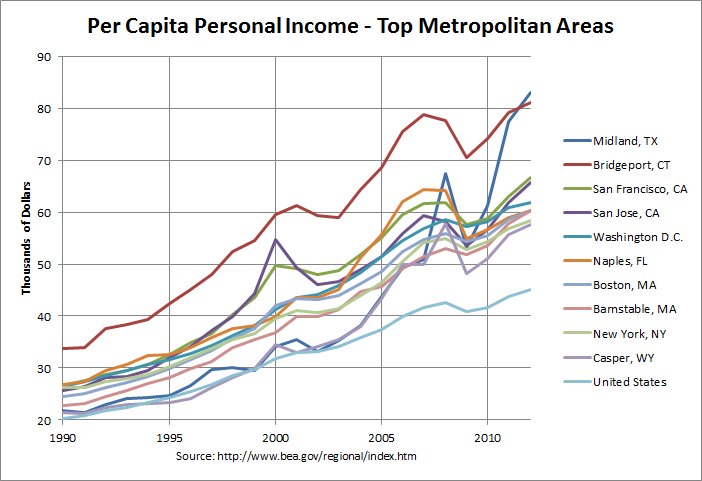
The following graph shows the 10 metropolitan areas which had the highest per capita personal income in 2012.

The numbers and sources for this and the following graph can be found at this link. Surprisingly, the metropolitan with the highest personal income is Midland, Texas. A recent article titled "Oil-rich Midland, TX is nation’s fastest growing metro area, with highest per-capita income in the country at $83,000" states:
For the third year in a row, Midland was the nation’s fastest growing MSA, with growth in personal income in 2012 of 12.1%. Midland also led the country as the MSA with the highest per capita personal income in 2012 at $83,049, followed by Bridgeport-Stamford-Norwalk, CT ($81,068), San Francisco ($66,591), the Silicon Valley MSA of San Jose-Santa Clara-Sunnvale ($65,679) and Washington, DC ($61,743).
The article goes on the explain that "America’s Shale Revolution is creating shale-based wealth, income, jobs and prosperity, especially in the states of Texas and North Dakota". This also likely has much to do with the recent rise of Casper, Wyoming to number 10 on the list.
A Bloomberg article from two years ago titled Rich Man, Poor Man: Connecticut Tops U.S. Wealth Gap says the following about the Bridgeport-Stamford-Norwalk metropolitan area:
In the Bridgeport-Stamford-Norwalk metro area, 53,076 households took home at least $200,000 -- and 16,505 earned less than $10,000.
“This region is a microcosm of the U.S.,” Pearson said.
Exacerbating the gap are the ranks of wealthy residents who have grown richer as the region became a hub for investment firms and hedge funds, she said. Median household income hovers 60 percent above the national figure at about $80,000.
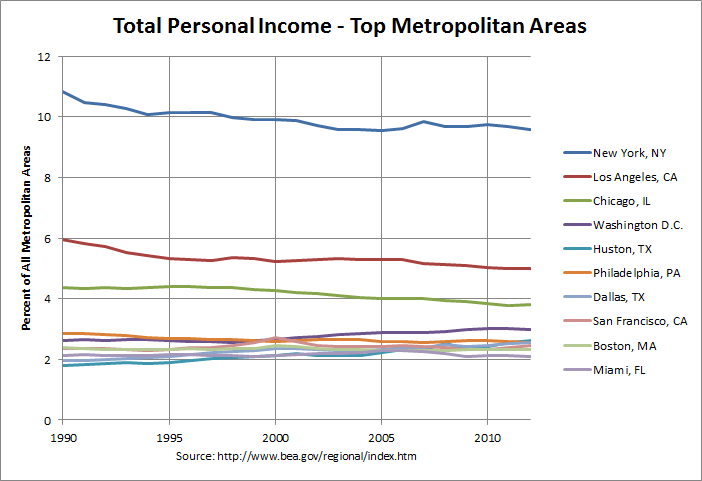
Hence, this article suggests that the high income has some relation to the area becoming a hub for investment firms and hedge funds. In any case, the Washington D.C. metropolitan area does not stand as an "opulent imperial city" in terms of per capita personal income. How about in terms of the total personal income? The following graph shows the 10 metropolitan areas which had the highest total personal income in 2012.

The graph shows each metropolitan area's total personal income as a percent of the total personal income of all metropolitan areas in the U.S. This was about $12.095 trillion in 2012. It should be noted that this was actually 88.1 percent of the total personal income in all of the U.S. in 2012 of about $13.729 trillion. The difference is that the latter figure includes the rural (non-metropolitan) areas.
The above graph is a little more as expected with the New York City area having by far the highest total personal income, followed by the Los Angeles area and then the Chicago area. As can be seen, the Washington D.C. area is fourth with just about 3 percent of the total personal income of all metropolitan areas. Hence, it's difficult to see how those who are having a hard time making ends meet should lay all blame on the "parasite class in Washington", as Mitchell describes them.
There does seem to be some agreement among many members of both parties that there is a problem with lobbyists, interest groups, and other insiders in Washington. However, there seems to be much disagreement about what to do about it. Some groups promote reforms of our campaign financing and other laws to better regulate these groups. In contrast, Mitchell ends his article with the following line:
P.P.P.S. Making government smaller is the only way to reduce the Washington problem of corrupt fat cats.
In any event, the above discussion shows the importance of looking at as much and as varied a selection of data as possible when studying economic issues. Even the above two graphs have their limitations. They say nothing about the distribution of income within those metropolitan areas and give no information as to what is going on immediately outside those areas. However, they give much, much more information than the simplistic comparison of one measure of a single city against an entire country.
Comments
Post a Comment