You Can't Soak the Rich - A Response
The data show that the tax yield has been independent of marginal tax rates over this period, but tax revenue is directly proportional to GDP. So if we want to increase tax revenue, we need to increase GDP.
In fact, this editorial is very reminiscent of one than ran less than a month ago titled "Obama's Tax Evasion". Both supported the proposition that tax cuts can increase revenue and both included a chart showing the relationship between two variables. And in both cases, the two variables selected were not comparable and only marginally related to the topic. That is, in both cases, the chart chose to compare apples and oranges and use this to reach a conclusion about bananas.
I addressed the problems with the prior editorial here. To explain the problems with this editorial, it helps to look at the following chart:
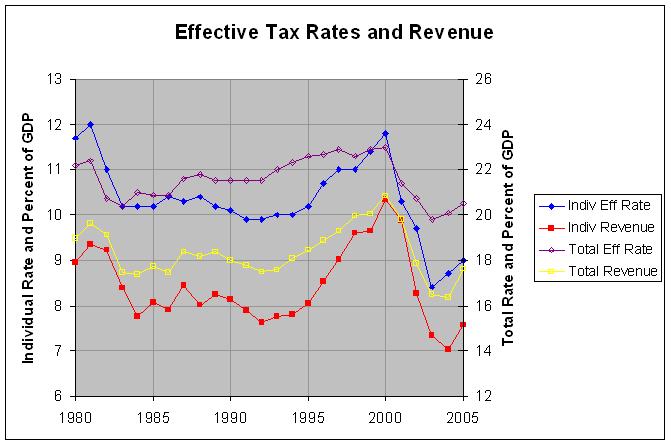
The actual numbers and sources are at http://www.econdataus.com/effrev05.html. The yellow line in the above chart corresponds pretty closely to the revenue line in the Wall Street Journal chart. Both appear to be in the 19.5% of GDP region. However, revenue do not seem anywhere near as flat in my chart as they appear in the Journal's chart. The reason for this is that my chart covers a range of just 14 percent of GDP while the Journal's chart covers a range of 90. Why didn't they use two scales as they did in the prior editorial? A cynic might say that they wanted to show a relationship in that chart but wanted to show no relationship at all in this chart.
In any event, I would contend that the biggest problem with the Journal's chart is the use of the top marginal rate. This rate tells you absolutely nothing about the levels of the other tax brackets or other changes in the tax code. A much better measure is the effective tax rate. A brief definition of effective tax rate is given here as "actual income tax paid divided by net taxable income before taxes, expressed as a percentage". Following is a more complete definition from page 4 of the source of the data in my chart:
Effective tax rates are calculated by dividing taxes by comprehensive household income. Comprehensive household income equals pretax cash income plus income from other sources. Pretax cash income is the sum of wages, salaries, self-employment income, rents, taxable and nontaxable interest, dividends, realized capital gains, cash transfer payments, and retirement benefits plus taxes paid by businesses (corporate income taxes and the employer's share of Social Security, Medicare, and federal unemployment insurance payroll taxes) and employee contributions to 401(k) retirement plans. Other sources of income include all in-kind benefits (Medicare, Medicaid, employer-paid health insurance premiums, food stamps, school lunches and breakfasts, housing assistance, and energy assistance). Households with negative income are excluded from the lowest income category but are included in totals.
In the above chart, the purple line is the effective rate that corresponds to the yellow line showing revenue from all federal taxes. Similarly, the blue line is the effective rate that corresponds to the red line showing the revenue just from individual income taxes. Note that the first two variables use the right scale and the second two use the left scale. As can be seen, an amazing thing happens when you compare the proper variables of the effective tax rate and the corresponding revenue. There is a very close positive correlation. That is, the effective tax rate and the corresponding revenue tend to go up and down together by similar amounts.
Of course, one could still contend that tax cuts can increase GDP growth. That would mean that, even though a cut in the effective tax rate would decrease revenue as a percent of GDP, that would be as a percent of a larger GDP. The issue of whether or not tax cuts appear to have noticeably effected GDP is addressed here. In any event, this is not what is proposed by "Hauser's Law" which the editorial's author stated is "as central to the economics of taxation as Boyle's Law is to the physics of gases". Hence, "Hauser's Law" as put forth by this editorial appears to be flatly false. Fortunately, Boyle's Law seems likely to hold up much better.


This is total nonsense. Hauser's "Law" is ideological claptrap that is taught in no serious economic program.
ReplyDeleteWhy? It restricts its analysis of taxation to the top income bracket, but it presents total government revenue. What happened in the period of 1950-2008 is that the top marginal rate generally went down, and the tax rates on everyone else generally went up. It is not surprising that overall revenues remained more-or-less flat, therefore. What happened was not some magical interference by the Invisible Hand, but a transfer of the tax burden from the very wealthy to the middle class. Not coincidentally, the middle class has been shrinking and real wages have been declining during the same period.
Hauser's Law joins the Laffer Curve* in the dustbin of right-wing voodoo economic theory. The only people who promote either are the people who, one way or another, benefit by doing so. Like those paragons of objective, scientific analysis at the WSJ editorial page.
*My favorite quote about the Laffer Curve came from my econ professor, who said "The Laffer Curve is relevant to policy in exactly the same way that the melting point of steel is relevant to washing the dishes."