You Can't Soak the Rich - A Response (Part 3)
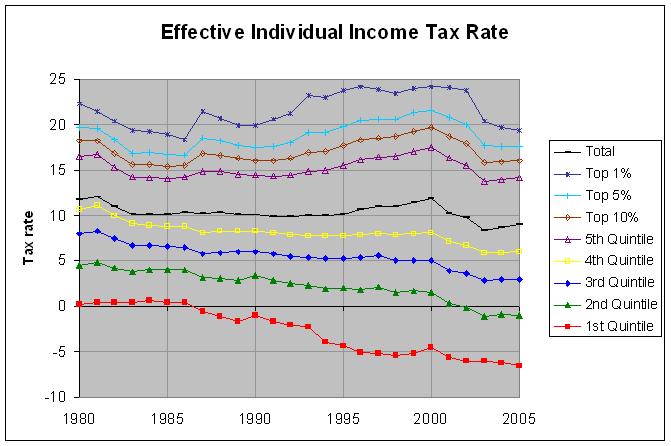
The actual numbers and sources are at http://www.econdataus.com/efftax05.html. The graph shows an interesting thing about the Tax Reform Act of 1986. This tax cut lowered the top marginal rate from 50 percent in 1986 to 28 percent in 1988. However, the graph shows that the effective tax rate dropped for every quintile EXCEPT the upper quintile during this period. This was most noticeably true for the top 1 percent of incomes where the effective rate rose from 18.3 percent in 1986 to 20.7 percent in 1988. As the numbers show, the average pretax income for the top 1 percent of incomes was between $689 thousand and $867 thousand during this period, well within the top marginal bracket. How is it that their effective rate went UP when the top marginal rate went down from 50 to 28 percent? The answer doubtlessly lies in the other measures of the Tax Reform Act of 1986 shown here. These included tax hikes such as the elimination of the preferential tax treatment of capital gains and the strengthening of the Alternative Minimum Tax, raising the rate to 21 percent. They also included cuts in deductions such as the repeal of the deductibility of state and local sales taxes, the repeal of the deduction for two-earner married couples, and the repeal of income averaging for all taxpayers. In any case, this shows that the top marginal rate is not even a reliable guide as to the level of taxation of the top 1 percent of incomes. The effective tax rate is a far superior guide.
One other interesting thing apparent in the above graph is that the effective tax rates of the bottom four quintiles all decreased from 1981 to 2000 whereas the effective tax rate of the top quintile remained fairly stable. The effective tax rate of ALL taxpayers remained fairly stable as well, pretty much following that of the top quintile. How was the effective tax rate of the lower four quintiles able to drop without having a noticeable effect on the effective tax rate of all taxpayers? Much of the answer likely lies in the following graph which shows the percent increase in the real (inflation-corrected) average pretax income of the quintiles:
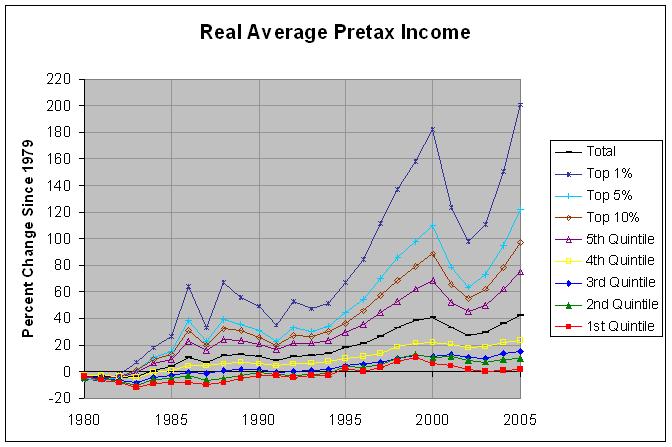
The actual numbers and sources are at the same location as the prior graph. As can be seen, the real pretax income of the lower quintile has hardly changed since 1979, rising just 1.3 percent from 1979 to 2005. The real incomes of the second, third, fourth, and fifth quintiles increased by 10, 14.7, 23.5, and 75.1 percent, respectively, over that same period. Finally, the real incomes of the top 10, 5, and 1 percent of incomes rose 97, 122, and 201 percent, respectively. In summary, the real incomes of each progressively higher bracket grew faster than the bracket below it.
Hence, the fact that the effective tax rate of ALL taxpayers did not decrease as the effective tax rates of the lower four quintiles decreased is likely due to the fact that a larger and larger percent of total income went to the top brackets and was therefore taxed at a higher rate. This might be easier to understand if one considers the case where the effective tax rates of all quintiles remain the same but more and more of the income goes to the top quintile. This would mean that more and more income would get taxed a higher rate, raising the effective tax rate paid by taxpayers as a whole.
The two graphs above taken together show that the effective tax rate of the upper income brackets did not noticeably decrease over the period from 1979 to 2005 despite the fact that the top marginal rate was halved from 70 percent to 35 percent over this period. The effective tax rate of the lower four income quintiles did decrease noticeably from 1979 to 2005. However, this was not necessarily due to the tax code becoming more progressive in any way. It was most likely due chiefly to the fact that a larger and larger percentage of all income flowed to the upper income brackets.


Comments
Post a Comment