Do Capital Gains Tax Cuts Raise Revenue? (Part 2)
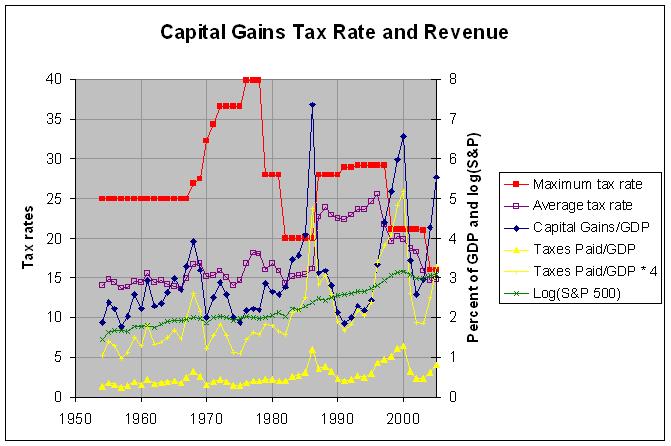
The actual numbers and sources are at http://www.econdataus.com/cgtax05.html. The above chart appears to match the Wall Street Journal chart except that it contains additional data and goes from 1954 to 2005 (the Wall Street Journal chart goes from 1962 to 2007). The red and dark blue lines in the above chart match the dark blue and light blue lines in the Wall Street Journal chart. About it's chart, the editorial says the following:
As the nearby chart shows, when the tax rate has risen over the past half century, capital gains realizations have fallen and along with them tax revenue. The most recent such episode was in the early 1990s, when Mr. Obama was old enough to be paying attention. That's one reason Jack Kennedy proposed cutting the capital gains rate. And it's one reason Bill Clinton went along with a rate cut to 20% from 28% in 1997.
The mention of the early 1990s would appear to be a misstatement. As can be seen from the above chart, capital gains realizations ROSE in every year from 1991 to 2000 except for a small drop (as a percentage of GDP) in 1994. The author likely meant to reference the increase in the capital gains tax rate in 1986. As the data shows, capital gains realizations nearly doubled from 4.08% of GDP in 1985 to 7.36% of GDP in 1986, just before the increase in the tax rate was to take place. It then dropped back and spent the next nine years around the 2 to 3 percent of GDP range, the range where it was from 1970 to 1982. It would seem clear that the large jump in realization in 1986 was caused by investors taking capital gains before the anticipated rise in the capital gains tax rate. That is one of the major difficulties in studying the effect of capital gains tax rates on revenues. For individual income taxes, it is very difficult to move large amounts of income from one tax year to another in anticipation or in response to a tax rate change. For capital gains taxes, however, this is very easily done by the timing of stock transactions.
In any case, there are a couple of problems with the Wall Street Journal chart. For one thing, it shows the maximum capital gains tax rate but leaves out the descriptor maximum. The chart above also shows the average tax rate. This is the tax rate that one would expect to have the most effect on tax revenue. As can be seen, the average tax rate generally followed the maximum tax rate from the 1986 tax increase on but was relatively stable, not following changes in the maximum tax rate, from 1954 to 1986. I believe that this is because of a major change in the tax law in 1986. As can be seen in this table, capital gains were taxed at the normal income rate before 1986 but with a portion of them (generally 50 to 60 percent of them) excluded from any taxes. After 1986, all capital gains were taxed but at a lower rate. This would appear to have caused more taxpayers to be effected by changes in the capital gains rates after 1986 (thus affecting the average tax rate) than before. In any case, this shows that the changes in the maximum tax rate give little information about what is happening with the average and lower tax rates.
A second problem with the Wall Street Journal chart is that it shows only the capital gains realizations, not the taxes derived from those realizations. The lower yellow line in the above chart shows those revenues. The upper yellow line shows those revenues multiplied by 4 so as to make it easier to compare them with the realizations. As can be seen, this upper yellow line is very close to the realizations (dark blue) line from 1988 through 1996 when the average tax rate was close to 25 percent. However, it dropped well below this line following the 1997 capital gains tax cut when the average tax rate dropped down to about 20 percent. The tax revenues generally follow realizations of course but, since it is the tax revenues that are the chief concern, this is what we should be looking at.
The green line in the above graph shows the common logarithm of the S&P 500 stock index. The logarithm values are useful in showing the index so that a constant percent increase (or decrease) in the index appears as a straight line sloping up (or down). It is useful to look at this index since the level of capital gains realizations is naturally affected by the movement in the market. From 1994 to 2000, the market began to rise sharply and this contributed to the rapid rise in realizations. Likewise, the rapid rise in realization in 2003 was affected by the rise in the market. This relation is somewhat complex as the holding period for realizations vary. For example, an S&P index fund that was bought in 2000 and sold in 2003 would have suffered a large capital loss whereas the same fund held since 1994 would have shown a large capital gain. In any case, the graph of the S&P 500 index gives some visual indication of what was going on in the market prior to any specific tax year.
The above discussion points to how difficult it is to study the relationship between capital gains tax rates and revenues. Hence, it is not intended to show a simple relationship but rather to show the problems with claims of simple relationships derived from looking at a few changes in the capital gains tax rate. That said, I did notice one interesting relationship in the data. From 1954 to 1982, there appeared to have been something of a positive correlation between the average capital gains tax rate and capital gains revenue. That is, they both tended in increase or decrease at the same time. After 1982, there appeared to be much more volatility in both the average tax rate and revenue and any obvious positive correlation disappeared. This would suggest that a more stable average tax rate might be desirable. This would lessen the need for investors to concern themselves with the timing of their stock transactions and allow them to concern themselves only with the long-term value of the investments themselves. If at any point that it is decided that the tax rate needs to be changed, it would likely be wise to phase in the change slowly.


Why waste your time "waving you hands" at graph which illustrates only some of the factors influencing a complicated phenomena. Reported capital gains (as a percentage of GDP) probably depends on a large number of factors: the current maximum tax rate, the increase in the value of the stock market over several previous periods (say, 3 years, 6 years, 10 years and 20 years), the actual increase or decrease in tax rate in the previous year, the planned change in the tax rate for the next year, and possibly the difference between the maximum tax rate on ordinary income and capital gains. So why don't you do the complete analysis by least-squares regression and find out how important each of these factors actually is. With luck, you'll have an equation that explains the source of most of the variation in reported capital gains. The size of the coefficient for the tax rate term (presumably negative) will tell us how much the capital gains rate depresses generation of capital gains. You'll want to report confidence intervals for this coefficient.
ReplyDeleteIf you multiply the equation predicting realized capital gains by the capital gains rate, you'll have a quadratic equation that predicts capital gains revenue. Then you can determine what range of capital gains rate produces the most revenue.
As I stated in the posting, the discussion was "not intended to show a simple relationship but rather to show the problems with claims of simple relationships derived from looking at a few changes in the capital gains tax rate". That's especially the case with the Wall Street Journal editorial which chose to look at the maximum capital gains tax rate (rather than the average) and at capital gains realizations (rather than capital gains taxes paid). I can understand them keeping the analysis relatively simple as a complex multi-variable equation would have likely gone over the head of nearly all of its readers. However, they chose two variables which were not really comparable and failed to even mention the existence of other very obvious variables.
ReplyDeleteRegarding the calculation of a complex multi-variable equation to relate capital gains taxes to all of the possible variables, I have neither the time or the background to create it. However, feel free to calculate such a formula and post a link to it here.
I am not exactly sure why simplistic conclusions are not possible here. Capitol Gains revenue tracks GDP - almost regardless of the rate. decreases int eh rate appear to produce short term spikes in revenue, increases produce short term drops. BUT on average capitol gains revenues appear to be a nearly constant with respect to GDP regardless of rate.
ReplyDeleteregardless as the other poster pointed out. the data likely exists to do a real analysis. WSJ conclusions though simplistic seem more valid than your challenge even based on your data