Do Tax Cuts Increase Revenue? (Part 2)
Hello my name is Marshall and i have some issues with your blog "EFFECT OF REAGAN, KENNEDY, AND BUSH TAX CUTS ON REVENUES" I found some issues here mainly involving the Reagan Tax cuts.
you say and i quote
"the GDP reached a high 10-year growth rate of 35.2% from 1983 to 1993. However, it reached higher highs of 37.5 from 1992 to 2002, 45.71% from 1947 to 1957, and 50.28% from 1958 to 1968. In fact, the above graph shows that the 10-year growth rate in the GDP has been relatively stable since 1975 to 1985 though it began to drop in 2008 and is projected to stay weak through 2015. Hence, these figures don't provide any strong evidence that the Reagan tax cuts permanently affected the GDP one way or the other."
As the reader states, his comment actually involves my analysis titled EFFECT OF REAGAN, KENNEDY, AND BUSH TAX CUTS ON REVENUES. The above quote is from the end of the section titled "EFFECT OF REAGAN TAX CUTS ON REVENUES AND GDP - LONG ANALYSIS". To give it more context, following is the full paragraph:
Hence, the evidence is that the Reagan tax cuts DECREASED revenues over what they would have been, at least over the short (10-year) term. The only remaining argument in favor of the Reagan tax cuts, at least from a revenue point of view, would seem to be that they permanently raised the level of the GDP, thus bringing in slightly higher revenues far into the future. According to the graph and second table, the GDP reached a high 10-year growth rate of 35.2% from 1983 to 1993. However, it reached higher highs of 37.5 from 1992 to 2002, 45.71% from 1947 to 1957, and 50.28% from 1958 to 1968. In fact, the above graph shows that the 10-year growth rate in the GDP has been relatively stable since 1975 to 1985 though it began to drop in 2008 and is projected to stay weak through 2015. Hence, these figures don't provide any strong evidence that the Reagan tax cuts permanently affected the GDP one way or the other.
The reader continues:
now there are some issues with this:
yes GDP growth was very consistent from the 40's to the 70's (though there was a slight decline in the 70's)and the 80's (January 1980-December 1990) from what it seems didn't change the GDP rating all that much compared to any of these decades. However it's worth noting that the GDP growth of the 90's was no where in comparison really (January 1990-December 2000. When looking at the mean/avg the 80's number seems to be in the ballpark of about 4.6, 4.7 GDP, however for the 90's it seems to be about 3.8, 3.9 somewhere in between these numbers so overall looking at that it does seem that Reagan's tax cuts may not have had any real impact but Clinton's tax increases (along with Bush 41's increases) didn't seem to be all that beneficial to GDP growth. My overall point being that tax cuts may not be that bad especially when compared to tax increases.
here's the website displaying GDP growth rate it's interactive as well:
http://www.tradingeconomics.com/united-states/gdp-growth
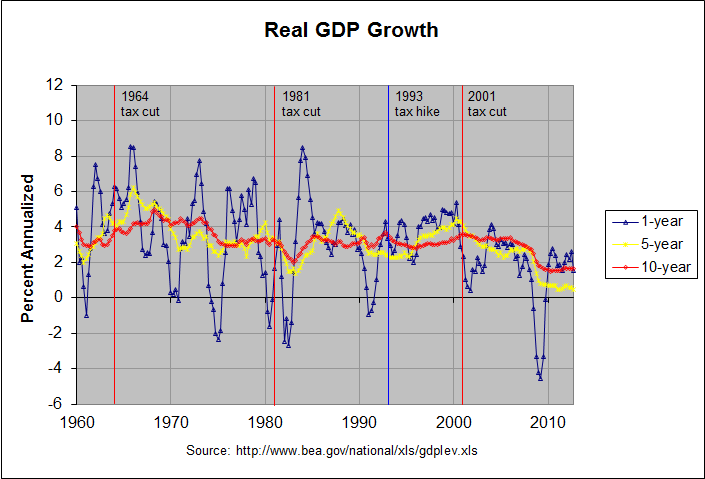
Can you provide your source for the above GDP growth numbers? They do not agree with the numbers that I have seen. The following graph is from my last blog post titled "Do Tax Cuts Increase Economic Growth?":

The blue, yellow, and red lines show the 1-year, 5-year, and 10-year annualized changes in the quarterly real GDP. The graph shows that the 10-year annualized change was relatively stable from 1974 to 2008, remaining between 2 and 4 percent for that entire period. Much of that apparent stability was due to the fact that 10 years just happens to be close to the length of several of the past business cycles. Recall that the three recessions prior to 2008 were in 2001, 1990-91, and 1980-82. That pattern was broken by the deep recession of 2008-09.
The above graph does not show GDP growth to have been noticeably better during the 80's than the 90's. To get a more accurate measurement, it is better to look at GDP growth over entire business cycles. The following table shows real GDP growth over all business cycles (taken from trough to trough) since 1949 as determined by the National Bureau of Economic Research:
                            REAL GDP GROWTH BY BUSINESS CYCLE

                GDP       GDP    Last Quarter          Entire Cycle
           (billion  (billion  ---------------- --------------------------
            current   chained  Percent  Annual-     # of  Percent  Annual-  Prior
Year  Qtr  dollars)   2005 $)   Change     ized Quarters   Change     ized  Trough   Trough
----  ---  --------  --------  -------  -------  -------  -------  -------  ------  -------
1949    4     265.2    1838.7     -0.9     -3.7
1954    2     376.0    2306.4      0.1      0.5       18     25.4     5.17  1949q4   1954q2
1958    2     458.0    2534.5      0.6      2.5       16      9.9     2.39  1954q2   1958q2
1961    1     528.0    2816.9      0.6      2.4       11     11.1     3.92  1958q2   1961q1
1970    4    1052.7    4253.0     -1.1     -4.2       39     51.0     4.32  1961q1   1970q4
1975    1    1569.4    4791.2     -1.2     -4.8       17     12.7     2.84  1970q4   1975q1
1980    3    2785.2    5771.7     -0.2     -0.7       22     20.5     3.44  1975q1   1980q3
1982    4    3312.5    5866.0      0.1      0.3        9      1.6     0.72  1980q3   1982q4
1991    1    5880.2    7943.4     -0.5     -1.9       33     35.4     3.74  1982q4   1991q1
2001    4   10373.1   11370.0      0.3      1.4       43     43.1     3.39  1991q1   2001q4
2009    2   13885.4   12701.0     -0.1     -0.3       30     11.7     1.49  2001q4   2009q2
2012    4   15829.0   13647.6      0.0     -0.1       14      7.5     2.08  2009q2   2012q4*

* 2012, quarter 4 has not been identified as a trough. It is just the most recent quarter.
Some of the business cycles are arguably too short to provide meaningful data. The following table combines the shorter business cycles to remedy this:
                REAL GDP GROWTH BY BUSINESS CYCLE (shorter cycles combined)

                GDP       GDP    Last Quarter          Entire Cycle
           (billion  (billion  ---------------- --------------------------
            current   chained  Percent  Annual-     # of  Percent  Annual-  Prior
Year  Qtr  dollars)   2005 $)   Change     ized Quarters   Change     ized  Trough   Trough
----  ---  --------  --------  -------  -------  -------  -------  -------  ------  -------
1949    4     265.2    1838.7     -0.9     -3.7
1961    1     528.0    2816.9      0.6      2.4       45     53.2     3.86  1949q4   1961q1
1970    4    1052.7    4253.0     -1.1     -4.2       39     51.0     4.32  1961q1   1970q4
1980    3    2785.2    5771.7     -0.2     -0.7       39     35.7     3.18  1970q4   1980q3
1991    1    5880.2    7943.4     -0.5     -1.9       42     37.6     3.09  1980q3   1991q1
2001    4   10373.1   11370.0      0.3      1.4       43     43.1     3.39  1991q1   2001q4
2009    2   13885.4   12701.0     -0.1     -0.3       30     11.7     1.49  2001q4   2009q2
2012    4   15829.0   13647.6      0.0     -0.1       14      7.5     2.08  2009q2   2012q4*

* 2012, quarter 4 has not been identified as a trough. It is just the most recent quarter.
As you can see in the table above, the 2 business cycles from 1980 to 1991 had an annualized GDP growth rate of 3.09 percent versus a slightly higher 3.39 percent during the business cycle from 1991 to 2001. The first table shows that the annualized GDP growth rate of the single business cycle from 1982 to 1991 was a slightly higher 3.74 percent. In any case, all of these growth rates are about the same and no where close to the 4.6 or 4.7 percent growth rate that you quote for the 80's above. Where did those numbers come from?
The reader continues:
now you also asked for examples of tax cuts being beneficial I have some links to provide but I'd like to say two things before hand
Actually, I said the following in my analysis:
There may well be valid arguments in favor of tax cuts. But higher tax revenues does not appear to be one of them.
Then in the blog post to which you replied, I concluded with the following:
As I mentioned, I am yet to find a single economic study that purports to show evidence that any income tax cut has ever paid for itself. If anyone who reads this should know of one, please leave a comment with a link to that study. Thanks.
In any case, the reader continues:
1. these links are obviously in favor of lower taxes they are the Heritage Foundation, a obviously Conservative site and also I believe it's called the Freedom and Prosperity Institute or so
2. I'm not sure if you've read them or not but they are worth looking in to also one of them is a video series which should be even easier though the video doesn't give any direct links it does refer to the IRS "SOI" which is something
that being said here are the links:
Heritage:
http://www.heritage.org/research/reports/2001/05/lowering-marginal-tax-rates,
http://www.policyarchive.org/handle/10207/bitstreams/8333.pdf
Both of those articles are written by Daniel J. Mitchell. In fact, I wrote a blog post that referenced the second article titled How to Mislead with Statistics. Following is an excerpt:
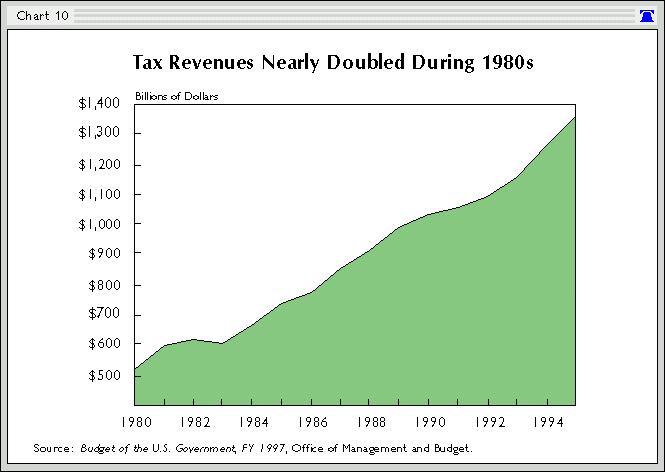
I first became familiar with Dr. Mitchell writings when he worked for the Heritage Foundation. The first one that I remember seeing was titled The Historical Lessons of Lower Tax Rates. Following is a chart from that article:

The numbers in this chart are similarly not corrected for inflation. The simplistic argument that "tax revenues nearly doubled in the 1980s" (as stated in the title) prompted me to post an analysis titled Effect of Reagan, Kennedy, and Bush Tax Cuts on Revenues. Following is the short analysis at the beginning of the article:
The argument that the near-doubling of revenues during Reagan's two terms proves the value of tax cuts is an old argument. It's also extremely flawed. At 99.6 percent, revenues did nearly double during the 80s. However, they had likewise doubled during EVERY SINGLE DECADE SINCE THE GREAT DEPRESSION! They went up 502.4% during the 40's, 134.5% during the 50's, 108.5% during the 60's, and 168.2% during the 70's. At 96.2 percent, they nearly doubled in the 90s as well. Hence, claiming that the Reagan tax cuts caused the doubling of revenues is like a rooster claiming credit for the dawn.
Furthermore, the receipts from individual income taxes (the only receipts directly affected by the tax cuts) went up a lower 91.3 percent during the 80's. Meanwhile, receipts from Social Insurance, which are directly affected by the FICA tax rate, went up 140.8 percent. This large increase was largely due to the fact that the FICA tax rate went up 25% from 6.13 to 7.65 percent of payroll. The reference to the doubling of revenues under Reagan commonly refers to TOTAL revenues. These include the above-mentioned Social Insurance revenues for which the tax rate went UP. It seems highly hypocritical to include these revenues (which were likely bolstered by the tax hike) as proof for the effectiveness of a tax cut.
Hence, what evidence there is suggests there to be a correlation between lower taxes and LOWER revenues, not HIGHER revenues as suggested by supply-siders. There may well be valid arguments in favor of tax cuts. But higher tax revenues does not appear to be one of them.
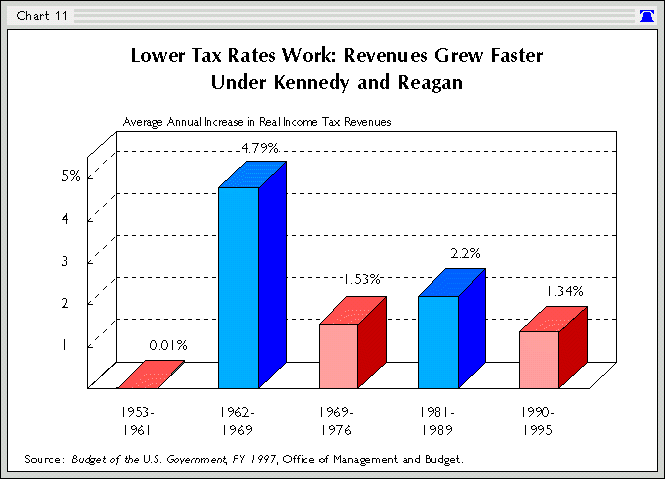
This is followed by a much longer analysis that corrects the numbers for inflation and looks at a number of other factors. In any case, the above chart in Dr. Mitchell's paper is followed by the following chart:

I wrote the following about this chart in 2005:
Chart 11 is titled "Lower Tax Rates Work: Revenues Grew Faster Under Kennedy and Reagan" and shows the average annual increase in real income tax revenues for five time spans. I believe that the time span 1962-1969 was meant to be 1962-1968 as that most closely matches the budget numbers. The table below shows the numbers from the chart and my own calculations from the 1997 U.S. Budget.
First year...............  1953   1962   1969   1977   1981   1990
Last year................  1961   1968   1976   1980   1989   1995
Number of years in span..     9      7      8      4      9      6
Revenue Growth (chart 11)  0.01   4.79   1.53   ----   2.2    1.34
Revenue Growth (budget)..  0.11   4.67   1.55   7.48   2.19   1.56
In looking at Chart 11, the first glaring question is what in the world happened to the time span 1977-1980!? Is it missing because it had a 7.48% growth rate, very much confusing the issue? In addition, why are the time spans of varying lengths?
The reader continues:
Conservative site:
http://thedauntlessconservative.wordpress.com/2010/09/01/the-reagan-tax-cuts-lessons-for-tax-reform/ <--- this one I myself am a bit skeptic of but he/she does provide a lot of links
these are the videos they are a three series set about the Laffer Curve they also go into detail about the Reagan Tax Cuts (somewhat)
http://www.youtube.com/watch?v=fIqyCpCPrvU <--- the first video goes into detail mostly about the Laffer Curve theory but talks about Tax Cuts and some fantasies about them
http://www.youtube.com/watch?v=YsB_rnzBA08 <--- this one reviews Reagan's tax cuts more in depth though again not all that much but it's still worth looking into
the third video doesn't go into that much detail about the Tax cuts so i won't post it though if the links work then you should be able to find it rather easily in the "other videos" list
I haven't had a chance to look closely at the conservative blog that you mentioned and will do so if I get a chance. However, I noticed that it includes a similarly simplistic graph as the one above, showing the growth in receipts during the 80's without correcting for inflation or comparing the growth to other periods. I did watch the two videos you linked to and I noticed that both of them are narrated by our good friend, Daniel J. Mitchell, after he moved to the Cato Institute. His arguments seem similar to those that he made in the articles he wrote at Heritage. They tend to be simplistic and incomplete (some might say cherry-picked). In any case, I would not depend on him as your chief source.
The reader concludes:
I myself am not very familiar with economics I'm only 18 though from what I have learned Tax Cuts DO NOT always pay for themselves but there are arguable examples of them doing so (i.e Reagan tax cuts) personally I think tax cuts only pay for themselves when the cut goes from 70 to 28 like it did with Reagan or when it goes from some obscenely high rate to a low rate regardless these are my sources if I find more I'll post them
As I said in my analysis of the Kennedy tax cut, "it would seem possible that Kennedy's tax cut was beneficial, at least in reducing this oppressive top marginal rate but that Reagan's tax cuts took the marginal rates to a level where the negative effects far outweighed any positive effects". Hence, I would say that the tax cut from 91 to 70 percent under Kennedy may have had overall beneficial effects. The data as I can read it is not clear on whether or not this tax cut lost revenue. However, a Washington Post article titled "Where does the Laffer curve bend?" asked a number of economists and most of them estimated the bend point to be between 50 and 70 percent. So if one accepts the simplicity of the Laffer curve, a tax cut to a rate above the bend point would increase revenue but a tax cut below that bend point would lose revenue. Of course, as suggested by the post to which you replied, there are likely other factors involved and the Laffer curve, while possibly a useful concept, is overly simplistic.
Note: There is a discussion of this post at this link.
Comments
Post a Comment