Do Tax Cuts Increase Economic Growth?
Real gross domestic product -- the output of goods and services produced by labor and property located in the United States -- decreased at an annual rate of 0.1 percent in the fourth quarter of 2012 (that is, from the third quarter to the fourth quarter), according to the "advance" estimate released by the Bureau of Economic Analysis. In the third quarter, real GDP increased 3.1 percent.
The Bureau emphasized that the fourth-quarter advance estimate released today is based on source data that are incomplete or subject to further revision by the source agency (see the box on page 4 and the "Comparisons of Revisions to GDP" on page 5). The "second" estimate for the fourth quarter, based on more complete data, will be released on February 28, 2013.
The release goes on to describe the components that contributed to the decrease:
The decrease in real GDP in the fourth quarter primarily reflected negative contributions from private inventory investment, federal government spending, and exports that were partly offset by positive contributions from personal consumption expenditures (PCE), nonresidential fixed investment, and residential fixed investment. Imports, which are a subtraction in the calculation of GDP, decreased.
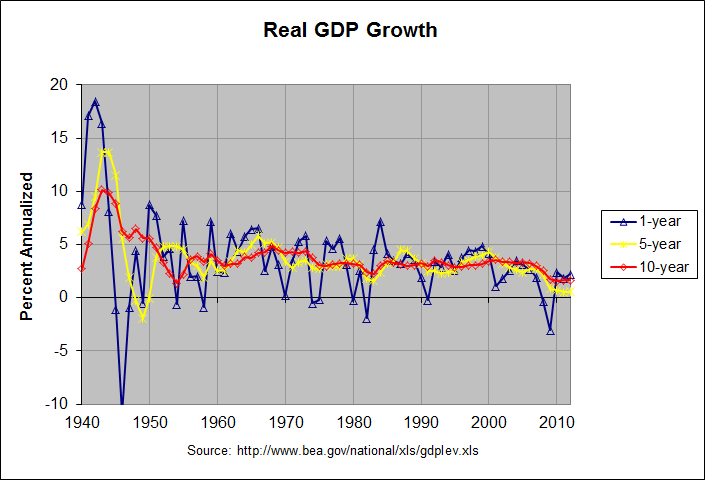
The BEA also released an updated spreadsheet containing the annual GDP figures since 1929 and quarterly GDP figures since 1947. The following graph shows the change in the annual real GDP figures since 1940:

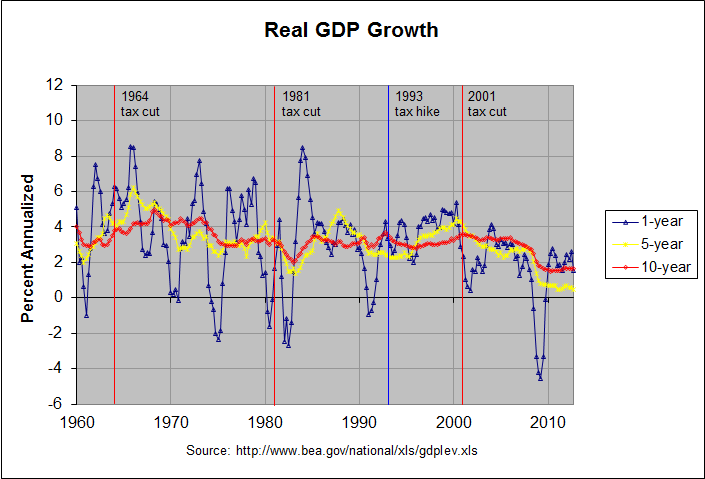
The actual numbers and sources for this and the following graph can be found at this link. The blue line shows the yearly change in the annual real GDP and the yellow and red lines show the 5-year and 10-year annualized changes, respectively. The following graph shows the change in the quarterly real GDP figures since 1960:

As before, the blue, yellow, and red lines show the 1-year, 5-year, and 10-year annualized changes in the quarterly real GDP. As can be seen, the 1-year change is the most volatile, the 5-year annualized change is less so, and the 10-year annualized change is even less so. In fact, the graph shows that the 10-year annualized change was relatively stable from 1974 to 2008, remaining between 2 and 4 percent for that entire period. Much of that apparent stability was due to the fact that 10 years just happens to be close to the length of several of the past business cycles. Recall that the three recessions prior to 2008 were in 2001, 1990-91, and 1980-82. That pattern was broken by the deep recession of 2008-09.
In fact, it is instructive to look at GDP growth over entire business cycles. The following table shows real GDP growth over all business cycles (taken from trough to trough) since 1949 as determined by the National Bureau of Economic Research:
                            REAL GDP GROWTH BY BUSINESS CYCLE

                GDP       GDP    Last Quarter          Entire Cycle
           (billion  (billion  ---------------- --------------------------
            current   chained  Percent  Annual-     # of  Percent  Annual-  Prior
Year  Qtr  dollars)   2005 $)   Change     ized Quarters   Change     ized  Trough   Trough
----  ---  --------  --------  -------  -------  -------  -------  -------  ------  -------
1949    4     265.2    1838.7     -0.9     -3.7
1954    2     376.0    2306.4      0.1      0.5       18     25.4     5.17  1949q4   1954q2
1958    2     458.0    2534.5      0.6      2.5       16      9.9     2.39  1954q2   1958q2
1961    1     528.0    2816.9      0.6      2.4       11     11.1     3.92  1958q2   1961q1
1970    4    1052.7    4253.0     -1.1     -4.2       39     51.0     4.32  1961q1   1970q4
1975    1    1569.4    4791.2     -1.2     -4.8       17     12.7     2.84  1970q4   1975q1
1980    3    2785.2    5771.7     -0.2     -0.7       22     20.5     3.44  1975q1   1980q3
1982    4    3312.5    5866.0      0.1      0.3        9      1.6     0.72  1980q3   1982q4
1991    1    5880.2    7943.4     -0.5     -1.9       33     35.4     3.74  1982q4   1991q1
2001    4   10373.1   11370.0      0.3      1.4       43     43.1     3.39  1991q1   2001q4
2009    2   13885.4   12701.0     -0.1     -0.3       30     11.7     1.49  2001q4   2009q2
2012    4   15829.0   13647.6      0.0     -0.1       14      7.5     2.08  2009q2   2012q4*

* 2012, quarter 4 has not been identified as a trough. It is just the most recent quarter.
Some of the business cycles are arguably too short to provide meaningful data. The following table combines the shorter business cycles to remedy this:
                REAL GDP GROWTH BY BUSINESS CYCLE (shorter cycles combined)

                GDP       GDP    Last Quarter          Entire Cycle
           (billion  (billion  ---------------- --------------------------
            current   chained  Percent  Annual-     # of  Percent  Annual-  Prior
Year  Qtr  dollars)   2005 $)   Change     ized Quarters   Change     ized  Trough   Trough
----  ---  --------  --------  -------  -------  -------  -------  -------  ------  -------
1949    4     265.2    1838.7     -0.9     -3.7
1961    1     528.0    2816.9      0.6      2.4       45     53.2     3.86  1949q4   1961q1
1970    4    1052.7    4253.0     -1.1     -4.2       39     51.0     4.32  1961q1   1970q4
1980    3    2785.2    5771.7     -0.2     -0.7       39     35.7     3.18  1970q4   1980q3
1991    1    5880.2    7943.4     -0.5     -1.9       42     37.6     3.09  1980q3   1991q1
2001    4   10373.1   11370.0      0.3      1.4       43     43.1     3.39  1991q1   2001q4
2009    2   13885.4   12701.0     -0.1     -0.3       30     11.7     1.49  2001q4   2009q2
2012    4   15829.0   13647.6      0.0     -0.1       14      7.5     2.08  2009q2   2012q4*

* 2012, quarter 4 has not been identified as a trough. It is just the most recent quarter.
As can be seen, the table now contains 5 groups from 1949 to 2001, each containing one or more full business cycles and being about 10 or 11 years in length. This is followed by the span from 2001 to 2009 which contains one full business cycle and is 7 and a half years in length. The final span from 2009 to present is not a full cycle since no ending trough has occurred. Still, the annualized growth in real GDP for these groups agree pretty much with the 10-year change seen in the graphs above. Real GDP growth from 1949 to 1970 was around 4 percent and was generally slightly above 3 percent from 1970 to 2001.
In the business cycle from 2001 to 2009, however, real GDP growth dropped to about 1.5 percent, less than half of its 1970 to 2001 rate. In the 3 and a half years since then, it's improved only slightly to about 2 percent. Since GDP growth tends to be better at the beginning of a business cycle, this will likely drop somewhat over the remainder of the cycle.
The second graph above shows the years of the three major tax cuts since 1960, the so-called Kennedy, Reagan, and Bush tax cuts. It also shows the so-called Clinton tax hike. As can be seen from the red line, these tax changes did not appear to cause any obvious changes in real GDP growth. Average GDP growth was perhaps a little higher following the Kennedy tax cuts. But, as mentioned, it was noticeably slower following the Bush tax cuts. Of course, there are all sorts of possible reasons for this slower GDP growth. Still, the data appears to provide no evidence that the Bush tax cuts served to increase real GDP growth.
Regarding the effect of taxes on growth, an article published on September 16th, 2012 in the Atlantic titled "Tax Cuts Don't Lead to Economic Growth, a New 65-Year Study Finds" begins as follows:
Here's a brief economic history of the last quarter-century in taxes and growth.
In 1990, President George H. W. Bush raised taxes, and GDP growth increased over the next five years. In 1993, President Bill Clinton raised the top marginal tax rate, and GDP growth increased over the next five years. In 2001 and 2003, President Bush cut taxes, and we faced a disappointing expansion followed by a Great Recession.
Does this story prove that raising taxes helps GDP? No. Does it prove that cutting taxes hurts GDP? No.
But it does suggest that there is a lot more to an economy than taxes, and that slashing taxes is not a guaranteed way to accelerate economic growth.
That was the conclusion from David Leonhardt's new column today for The New York Times, and it was precisely the finding of a new study from the Congressional Research Service, "Taxes and the Economy: An Economic Analysis of the Top Tax Rates Since 1945."
Following is the end of the summary given in the Congressional Research Service study:
Analysis of such data suggests the reduction in the top tax rates have had little association with saving, investment, or productivity growth. However, the top tax rate reductions appear to be associated with the increasing concentration of income at the top of the income distribution. The share of income accruing to the top 0.1% of U.S. families increased from 4.2% in 1945 to 12.3% by 2007 before falling to 9.2% due to the 2007-2009 recession. The evidence does not suggest necessarily a relationship between tax policy with regard to the top tax rates and the size of the economic pie, but there may be a relationship to how the economic pie is sliced.
Of course, there are some who disagree with this conclusion. David Leonhardt described Paul Ryan's response when asked to explain why a cut in tax rates would work better this time than last time as follows:
“I wouldn’t say that correlation is causation,” Mr. Ryan replied. “I would say Clinton had the tech-productivity boom, which was enormous. Trade barriers were going down in the Clinton years. He had the peace dividend he was enjoying.”
The economy in the Bush years, by contrast, had to cope with the popping of the technology bubble, 9/11, a couple of wars and the financial meltdown, Mr. Ryan continued. “Some of this is just the timing, not the person,” he said.
He then made an analogy. “Just as the Keynesians say the economy would have been worse without the stimulus” that Mr. Obama signed, Mr. Ryan said, “the flip side is true from our perspective.” Without the Bush tax cuts, that is, the worst economic decade since World War II would have been even worse.
Regarding timing, the table above shows that economic growth slowed markedly following the Bush tax cuts even when measured over full business cycles. And as described at this link, economic growth was subpar even before the financial meltdown. Still, Ryan is admitting that there are factors other than taxes that affect economic growth. For that reason, proponents of the idea that tax cuts increase economic growth need to provide strong evidence of that contention. It certainly is not apparent in the data above.
Note: There is a discussion of this post at this link.
Comments
Post a Comment