The Financial Report of the United States Government
The Budget's emphasis is on initiatives and how resources will be used, focusing on the Government's spending surplus or deficit. The Report focuses on the Government's net operating cost - how resources have been used to fund programs and services. How does the Government’s largely cash-based spending deficit differ from the largely accrual-based net operating cost?
- The Budget shows receipts, or cash paid to the Government (e.g., income tax payments and national park fees received); while the Report presents revenue, or amounts that the Government has earned, some of which has not yet been received.
- The Budget reports cash outlays when the Government makes payments to individuals, businesses or other parties. The financial statements reflect costs in the period in which resources are consumed or liabilities increased.
- From Table 2, almost the entire difference between these two reports can be explained by a single item. The Budget does not include $90.1 billion in postemployment benefits earned by, but not yet due to be paid to, employees in fiscal year 2007.
- Similarly, the Budget does not include an estimated $36.8 billion of additional clean-up costs that the Government will eventually have to pay to fund environmental efforts (e.g., EPA Superfund).
- Conversely, the Budget does include more than $13 billion in net spending for Capitalized Fixed Assets. For Budget purposes, the entire purchase price for major assets, such as buildings or aircraft carriers must be shown as a cost in the year of outlay. However, due to their estimated longevity, agencies capitalize and depreciate (i.e., spread) the cost of these assets over their ‘useful lives’ in the financial statements.
Table 2 mentioned in the third point above shows the difference between the Unified Budget Deficit and the Net Operating Cost for 2006 and 2007. The following graph shows the same basic information for 1998 through 2007:
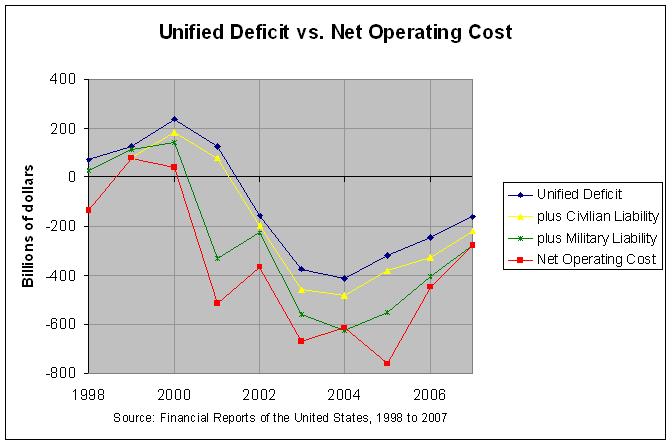
The actual numbers and sources are at http://www.econdataus.com/frus07.html. As can be seen from the first table, the $90.1 billion mentioned in the third point refers to liabilities for civilian, military, and veteran postemployment benefits. Liabilities for civilian postemployment benefits have varied between $39 billion and $84 billion since 1998. Liabilities for military and veteran postemployment benefits have varied a bit more widely with those for the military jumping a large $407 billion in 2001. Page 12 of the 2002 Financial Report gives the following explanation for this:
During fiscal 2001, there was an increase of $406.8 billion for military employees benefits, which was mostly due to reflecting the initial non-recurring effect of the National Defense Authorization Act and other actuarial assumption changes. In addition, there was an increase of $139.3 billion for liability for veterans compensation and burial benefits caused by changes in interest rate and other actuarial assumptions.
There is additional information on page 110 of that report. In any case, the main point evident from the above graph is that the net operating cost calculated in the Financial Reports has been notably larger than the unified budget deficit calculated in the U.S. Budget.
The following graph shows the difference between the "Debt Held by the Public" (from the Budget) and the "Net Position" (from the Financial Report):
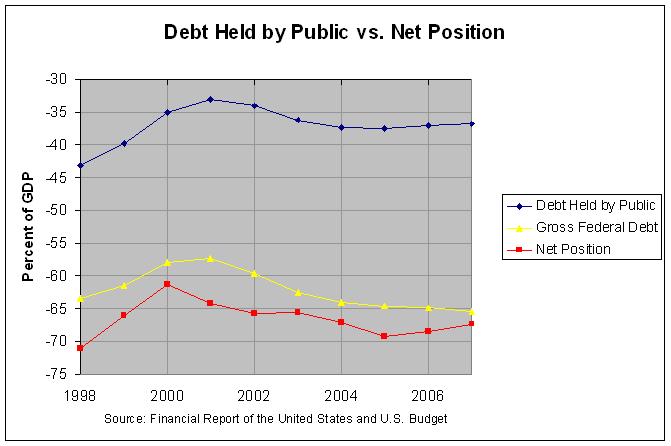
As before, the actual numbers and sources are at http://www.econdataus.com/frus07.html. The debt held by the public and the net position are the cumulative effects of the unified deficit and net operating cost, respectively. Each year's net position is equal to the prior year's net position plus that year's net operating cost (with some minor adjustments). Similarly, each year's debt held by the public is equal to the prior year's debt plus the unified deficit (plus some minor adjustments). As can be seen from the above graph, the debt held by the public is about 37 percent of GDP and has improved slightly the past two years. The net position has likewise improved slightly the past two years but is a much larger 67 percent of GDP. Also shown is the "Gross Federal Debt". Following is an excerpt from a prior post that explains the difference between this and the debt held by the public:
These debts are currently about 9.3 trillion dollars and 5.2 trillion dollars, respectively, and are related in that the gross federal debt is equal to the debt held by the public plus "intragovernmental holdings". This intragovernmental debt is chiefly held by trust funds with a bit more than half of it being held by the Social Security trust fund. A list of these trust funds, along with the actual numbers and sources for the graph above can be found at http://www.econdataus.com/debt09.html.
As can be seen, the gross federal debt has continued to get worse since 2001. It should be noted that the net position does not include liabilities for Social Security and Medicare. Those are addressed separately in the Financial Reports. In any event, the net position gives a somewhat more troubling view of our financial condition than does the unified budget deficit. That is especially the case with the pending retirement of the Boomers.
The Financial Report of the United States Government (Part 2)


A series of debt can lead to a very difficult cycle of unmanageable finances. We should find ways on reducing debt the cheapest way possible and enjoy financial freedom. Thanks for the article!
ReplyDeleteI'm glad that you found it useful. I became aware of the Financial Report just a few years ago and it seems like a good complement to the U.S. Budget for monitoring our financial condition.
ReplyDelete