The Financial Report of the United States Government (Part 2)
For the ‘social insurance’ programs (e.g., Social Security, Medicare Parts A, B, and D), the Statement of Social Insurance (SOSI) shows the estimated future scheduled benefit expenses net of contributions and tax income (excluding interest), based on each program’s actuarial trust fund report.
Table 8 shows estimated net social insurance and other exposures for both the ‘open-group’ and ‘closed-group’ population, which differ based on the population measured. As shown in Image 3, the ‘closed group’ pertains to individuals age 14 and over on January 1 of the valuation year and/or those who have met or will meet other eligibility requirements during the projection period (typically 75 years). In short, it represents an estimate of the responsibility, under current law, of future taxpayers to pay benefits to current participants. By comparison, the ‘open group’ is comprised of workers who will enter covered employment during the period, as well as those already in covered employment at the beginning of that period. That is, it represents the ‘closed group’ plus all future projected participants who will make contributions to postemployment benefit plans and/or will be eligible for benefits over the 75-year projection period). Since the open group's contributions will significantly exceed benefits earned during the projection period, it can be expected that the net social insurance benefits for the open group ($40,948 billion in 2007) would be less than that for the closed group ($45,062 billion).
The following graph shows the social insurance exposure for the open group as calculated in the Financial Report for every year since 2000:
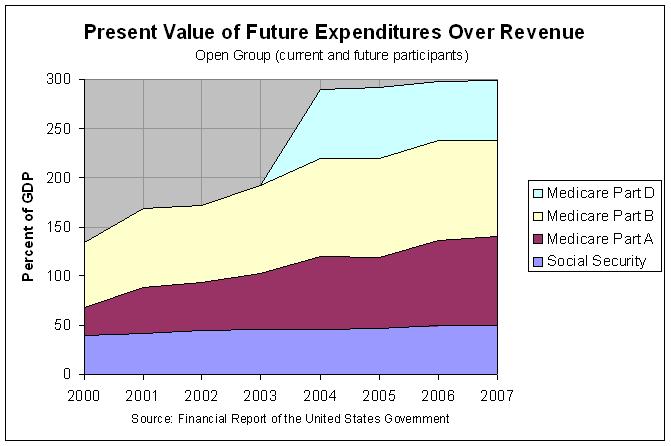
The actual numbers and sources are at http://www.econdataus.com/pver07.html. As can be seen, the exposure for Social Security has remained fairly stable since 2000 but the exposure for Medicare Part A and B have been growing more noticeably. Also, the additional exposure created by Medicare Part D (the Prescription Drug Coverage) in 2004 is very apparent.
Finally, the graph shows that the present value of the exposure of Social Security and Medicare over the next 75 years is estimated to be about 300 percent of GDP. This is over four times the absolute size of our current Net Position of minus 67.4 percent of GDP. However, the following excerpt on page 25 of the 2007 Financial Report warns about comparing these values:
This forward-looking information combined with other financial statements and information provides both a short- and long-term view of significant financial issues facing the Government. As indicated above, however, it should be noted that significant differences exist between balance sheet liabilities and the exposures from the SOSI, which limit their comparability:
* The Balance Sheet presents a ‘snapshot’ at a point in time of an entity’s current financial condition, with an emphasis on how current and prior actions and events have impacted its assets and liabilities.
* The SOSI presents the calculated net present value of future estimated revenues and expenditures over an extended period. They represent an assessment of the extent to which the social insurance programs are out of balance under current financing arrangements relative to scheduled benefit obligations. Since they are not liabilities, and therefore do not impact either an entity’s current assets or liabilities, they are not included on the balance sheet according to Federal accounting standards.
In any case, the following graph shows the social insurance exposure for the closed group (consisting of current participants only):
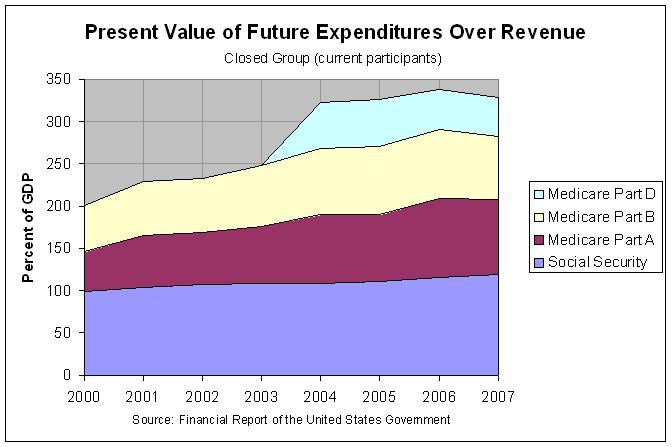
As before, the actual numbers and sources are at here. The main difference that can be seen from the prior graph is that the exposure for Social Security is more than double. I believe that the main reason that Social Security is so much more affected than Medicare is that it is funded by a much larger percent of the FICA tax. Employee and employer each pay 6.2 percent of the FICA tax toward Social Security but just 1.45 percent toward Medicare. A portion of Medicare is funded by premiums paid by beneficiaries and by infusions from the general fund. Hence, Social Security would be much more affected if future participants left the system. This gives some idea of the so-called transition costs that would need to be paid to move to a prepaid retirement system.


Comments
Post a Comment