Who Will See Their Taxes Go Up under the House and Senate Plans?
Example A - Single Person Making $25,000 Per Year with $12,000 in Deductions             Example B - Married Couple Making $50,000 Per Year with $24,000 in Deductions

House                              Senate                                                House                              Senate
         Names      Taxes                   Names      Taxes                                      Names      Taxes                   Names       Taxes
1 Current 2018  885.00000          1 Current 2018  885.00000                             1 Current 2018 1770.00000          1 Current 2018 1770.00000
2   House 2018 1236.00000          2  Senate 2018 1369.50000                             2   House 2018 2472.00000          2  Senate 2018 2739.00000
3       Change  351.00000          3       Change  484.50000                             3       Change  702.00000          3       Change  969.00000
4     % Change   39.66102          4     % Change   54.74576                             4     % Change   39.66102          4     % Change   54.74576

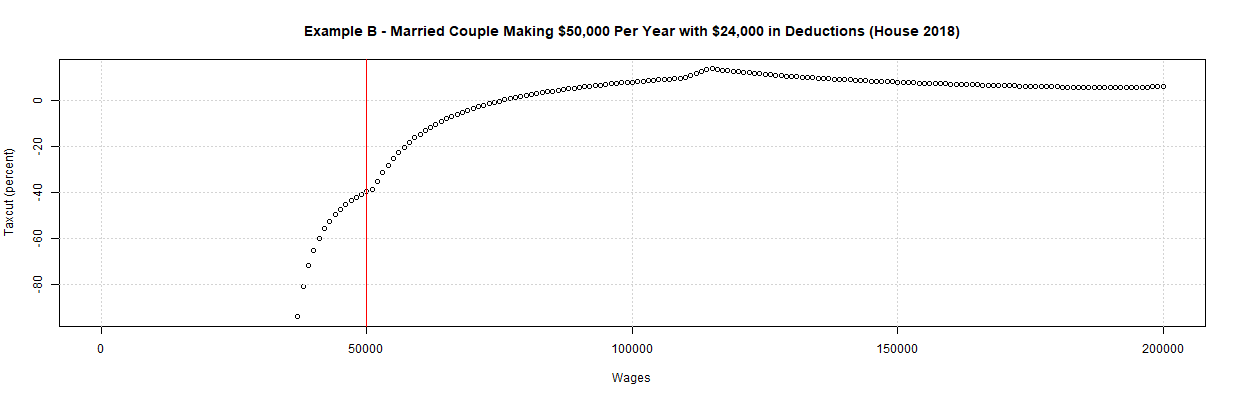
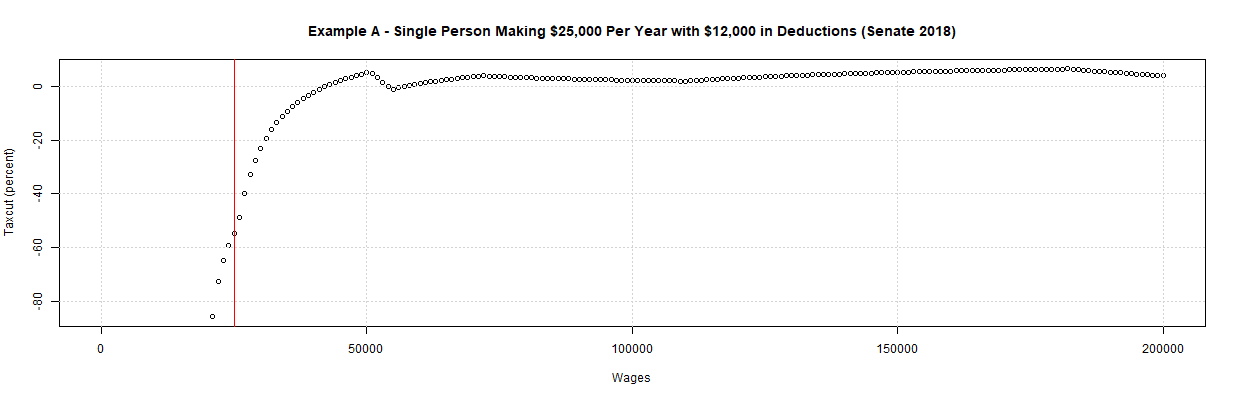
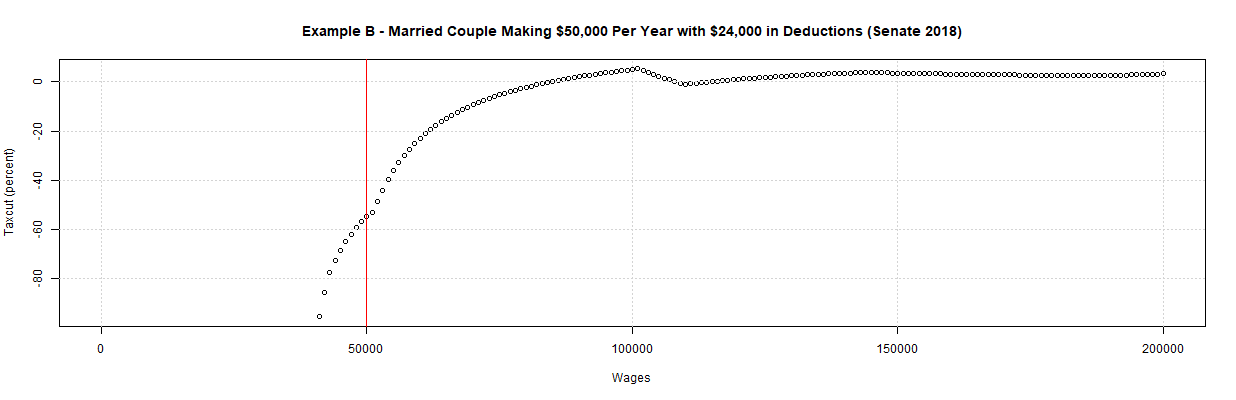
As can be seen in the first table, a single person making $25,000 per year and having $12,000 in deductions (same as the new standard deduction in the Senate plan) will now have to pay nearly 40 percent more in taxes under the House plan. The result is the same however the $12,000 is divided up among deductions, regardless of whether or not those deductions are still allowed. As can be seen in the third table, a married couple making $50,000 per year and having $24,000 in deductions (same as the new standard deduction in the Senate plan) will now have to pay nearly 40 percent more in taxes under the House plan. As before, the result is the same however the $24,000 is divided up among deductions. In fact, it's interesting to note that the taxes in this table are exactly double the taxes in the prior table and the percent change in taxes is the same 39.66 percent increase. This is because a number of other key variables like income and standard deduction are also exactly double.
The second and fourth tables and the last two plots show the change in taxes under the Senate plan. As can be seen, both single and married taxpayers get an even larger tax increase of over 54 percent under this plan. The main reason for the difference is chiefly that the House plan has a family credit of $300 that applies to the parents whereas the Senate plan has a non-child dependent credit of $500 which does NOT apply to the parents. Hence, it's important to note that the $300 credit in the House plan covers the parents but the $500 credit in the Senate plan does not. An additional concern, however, is that the $300 House credit is currently scheduled to expire in 5 years. Selecting "House 2018 w/o Family Credits" for Tax Plan 2 shows that taxes increase over 73 percent for both Examples A and B in this case. The chief reason for this is likely that the Senate plan retains the 10 percent bracket while the House plan raises it to 12 percent.
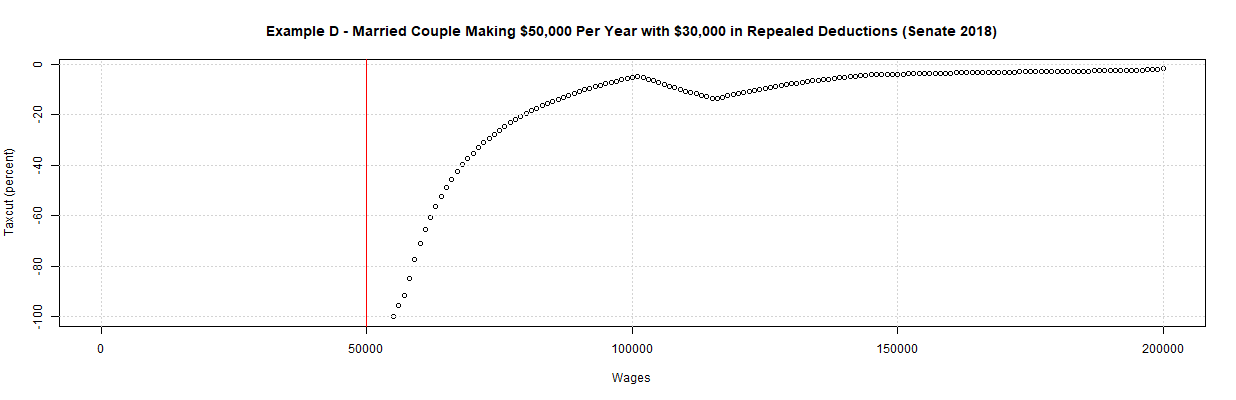
What happens if the taxpayer currently has deductions that are higher than the new standard deduction? If the additional deductions have not been repealed, their should be little difference as the taxpayer can continue to deduct them. The result is very much different if those additional deductions have been repealed. The following tables and plots show the change in taxes for such taxpayers, single and married, under the House and Senate tax bills. For single taxpayers, they show the effect of $3,000 ($2,800 for the House) of additional repealed deduction and for married taxpayers, they show the effect of $6,000 ($5,600 for the House) in additional repealed deductions. The tables and plots were generated by selecting Examples C and D in the same interactive application.
Example C - Single Person Making $25,000 Per Year with $15,000 in Repealed Deductions    Example D - Married Couple Making $50,000 Per Year with $30,000 in Repealed Deductions

House                              Senate                                                House                              Senate
         Names     Taxes                    Names     Taxes                                       Names     Taxes                    Names      Taxes
1 Current 2018  585.0000           1 Current 2018  585.0000                              1 Current 2018 1170.0000           1 Current 2018 1170.0000
2   House 2018 1236.0000           2  Senate 2018 1369.5000                              2   House 2018 2472.0000           2  Senate 2018 2739.0000
3       Change  651.0000           3       Change  784.5000                              3       Change 1302.0000           3       Change 1569.0000
4     % Change  111.2821           4     % Change  134.1026                              4     % Change  111.2821           4     % Change  134.1026
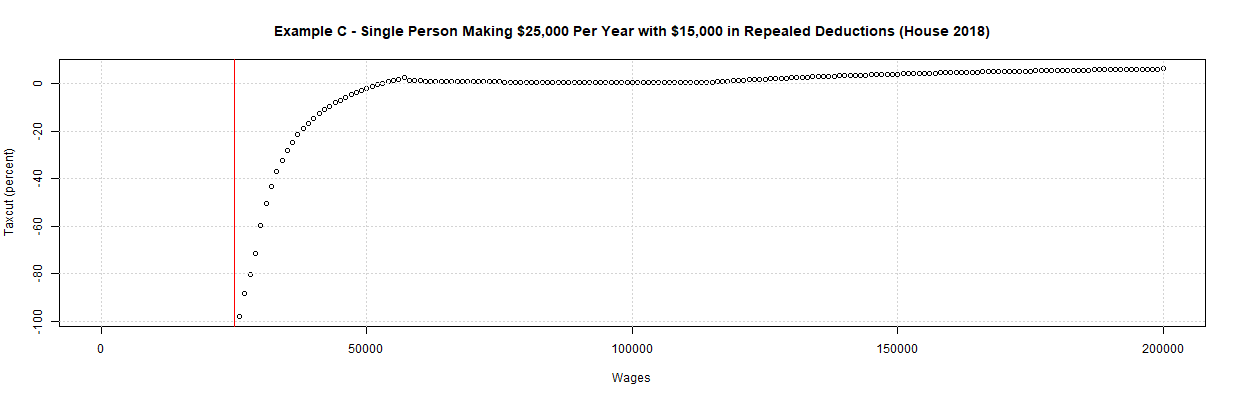
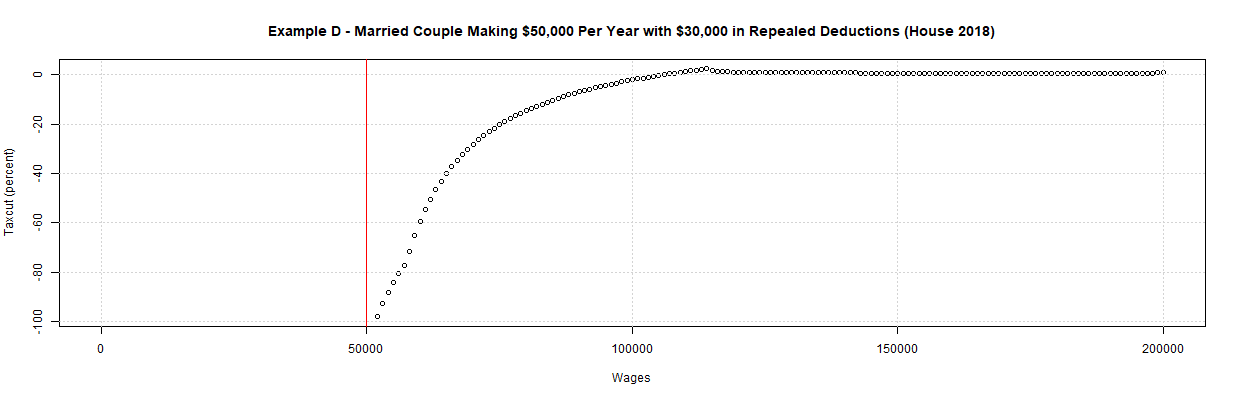
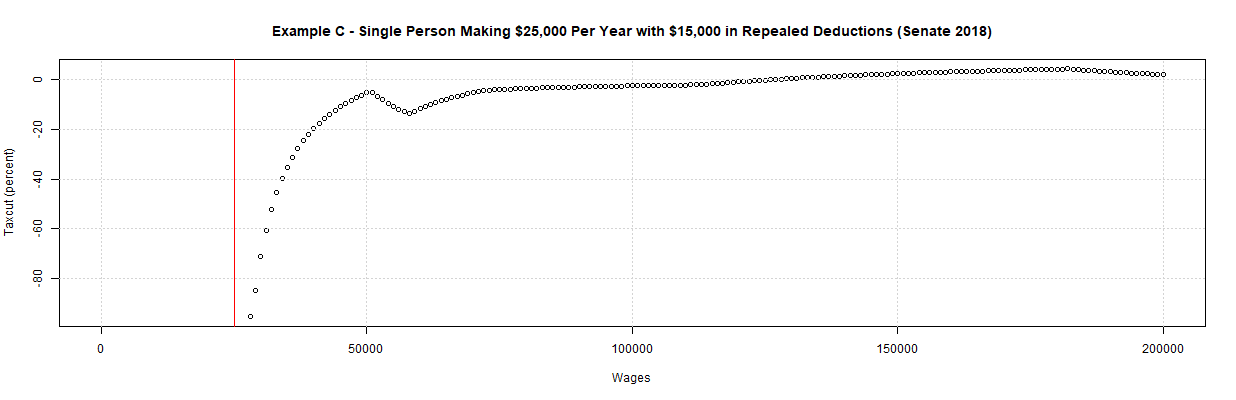
As can be seen in the first table, a single person making $25,000 per year and having $15,000 in deductions ($2,800 more than the new standard deduction in the House plan) will now have to pay over 111 percent more in taxes under the House plan. The result is the same however the $15,000 is divided up among deductions, as long as they include at least $2,800 in deductions that are being repealed. As can be seen in the third table, a married couple making $50,000 per year and having $30,000 in deductions ($5,600 more than the new standard deduction in the House plan) will now have to pay over 111 percent more in taxes under the House plan. As before, the result is the same however the $30,000 is divided up among deductions, as long as they include at least $5,600 in deductions that are being repealed. As before, it's interesting to note that the taxes in the third table are exactly double the taxes in the first table and the percent change in taxes is the same 111.28 percent increase. Again, this is because a number of other key variables like income and standard deduction are also exactly double.
The second and fourth tables and the last two plots show the change in taxes under the Senate plan. As can be seen, both single and married taxpayers get a larger tax increase of over 134 percent under this plan. As before, the main reasons for the difference from the House plan is chiefly that the $300 Family Credit in the House applies to parents but the $500 Non-child Dependent Credit in the Senate does not.
The prior examples look at cases with the same deduction across all income levels. State and local taxes, of course, will be more related to a percentage of the taxpayer's income. The following tables and plots show the change in taxes for taxpayers paying 10 percent of their income in state and local taxes, under the House and Senate tax bills. The tables and plots were generated by selecting Examples E and F in the same interactive application. For these examples, the maximum wage is automatically increased from $200,000 to $2,000,000 since this negative effects of this change mainly effects taxpayers with higher incomes. Also, the specific wages for the tables were chosen to be close to local minimums shown in the plots.
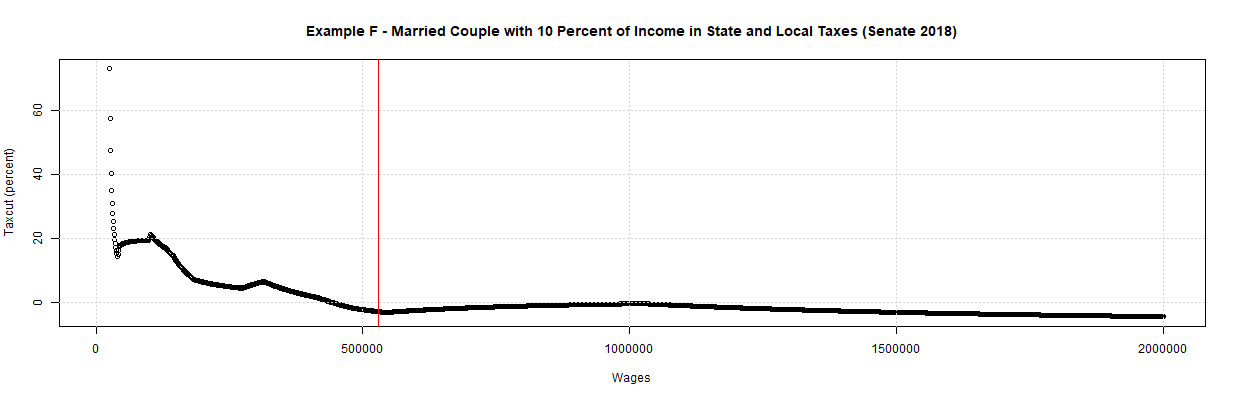
Example E - Single Person with 10 Percent of Income in State and Local Taxes             Example F - Married Couple with 10 Percent of Income in State and Local Taxes
                     ($470,000 in wages)                                                                      ($530,000 in wages)

House                              Senate                                                House                              Senate
         Names        Taxes                 Names        Taxes                                    Names        Taxes                 Names        Taxes
1 Current 2018 121290.75000        1 Current 2018 121290.75000                           1 Current 2018 1.302715e+05        1 Current 2018 1.302715e+05
2   House 2018 134080.00000        2  Senate 2018 136796.00000                           2   House 2018 1.386600e+05        2  Senate 2018 1.340920e+05
3       Change  12789.25000        3       Change  15505.25000                           3       Change 8.388500e+03        3       Change 3.820500e+03
4     % Change     10.54429        4     % Change     12.78354                           4     % Change 6.439244e+00        4     % Change 2.932721e+00
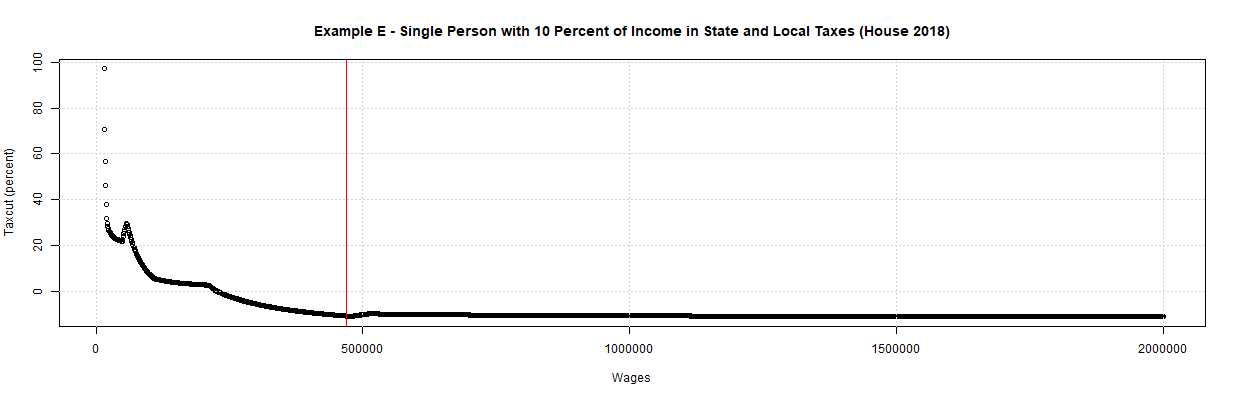

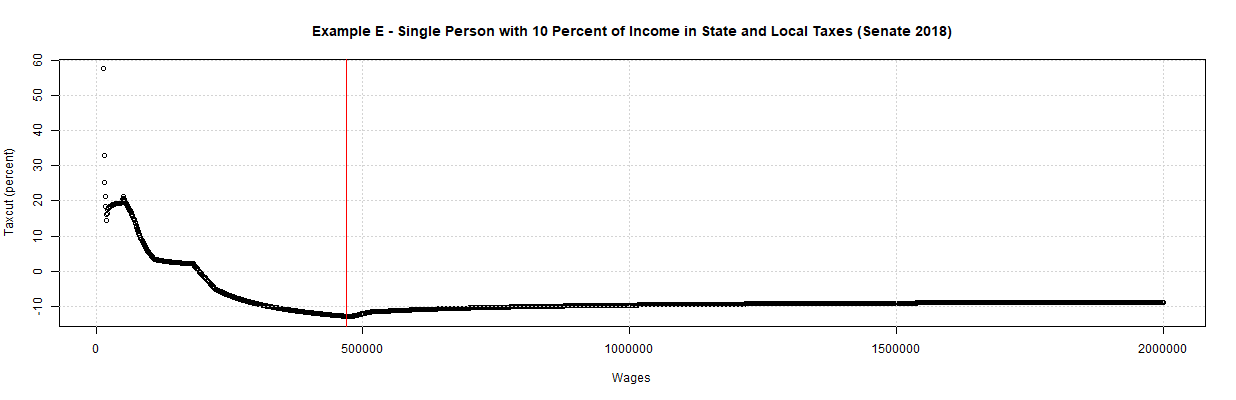
As can be seen in the first table, a single person making $470,000 per year and paying 10 percent of their wages in state and local taxes will now have to pay 10.54 percent more in taxes under the House plan. The second table shows that this increases to be 12.78 percent under the Senate plan. The reason for the difference appears to be slightly more favorable tax brackets for a single taxpayer with those wages in the House bill. In any case, the first plot shows that the increase in taxes continues through a 2 million dollar income at about 10 percent under the House bill. The third plot shows that the increase in taxes through a 2 million dollar income becomes slightly smaller under the Senate bill. This appears to be due to the cut in rates from 39.6 to 38.5 percent under the Senate bill for incomes over $500,000.
As can be seen in the third table, a married couple making $530,000 per year and paying 10 percent of their wages in state and local taxes will now have to pay 6.44 percent more in taxes under the House plan. The fourth table shows that this decreases to 2.93 percent under the Senate plan. The reason for the difference appears to be slightly more favorable tax brackets for a married couple with those wages in the Senate bill. In any case, the increase in taxes is 6.79 and 4.45 percent at a 2 million dollar income under the House and Senate bills, respectively, according to the application. As can be seen in second and fourth plots, these increases become close to zero (a tax increase of 1.6 percent and a tax cut of 2.8 percent according to the application) at a 1 million dollar income. This upward bulge at 1 million dollars appears to be due to the fact that both plans increase the income at which the tax bracket starts from $470,700 to 1 million dollars.
A final concern is the effect of the tax plans on non-child dependents. Both plans benefit taxpayers with children in that the child credit is increasing under both. The effect on non-child dependents is less clear, however. This is because both plans eliminate the Exemptions but provide a credit to compensate. The following tables and plots show the change in taxes for single taxpayers with one non-child dependent and married couples with two non-child dependents, under the House and Senate tax bills. The tables and plots were generated by selecting Examples G and H in the same interactive application.
Example G - Single Person Making $25,000 Per Year with 1 Non-Child Dependent             Example H - Married Couple Making $50,000 Per Year with 2 Non-Child Dependents

House                              Senate                                                House                              Senate
         Names      Taxes                   Names      Taxes                                      Names      Taxes                   Names      Taxes
1 Current 2018 1053.75000          1 Current 2018 1053.75000                             1 Current 2018 2107.50000          1 Current 2018 2107.50000
2   House 2018  936.00000          2  Senate 2018  869.50000                             2   House 2018 1872.00000          2  Senate 2018 1739.00000
3       Change -117.75000          3       Change -184.25000                             3       Change -235.50000          3       Change -368.50000
4     % Change  -11.17438          4     % Change  -17.48517                             4     % Change  -11.17438          4     % Change  -17.48517
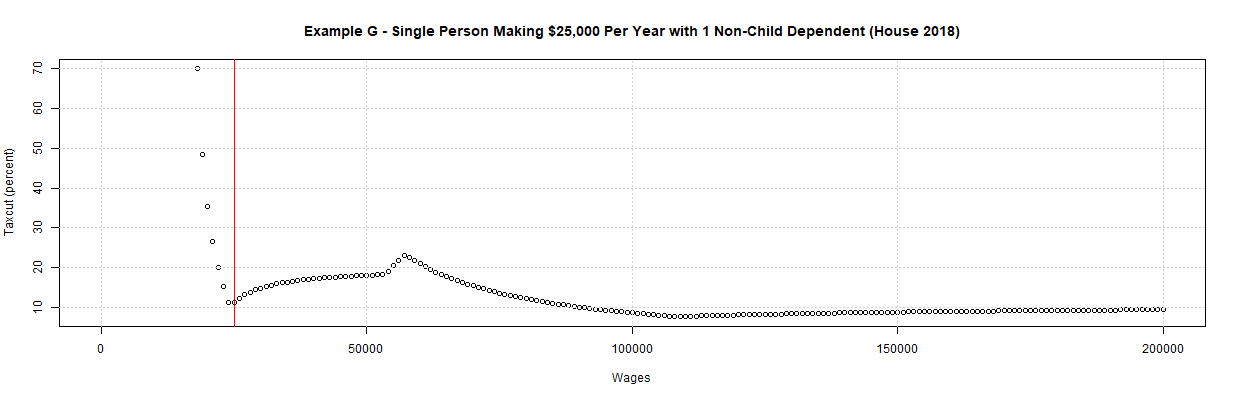
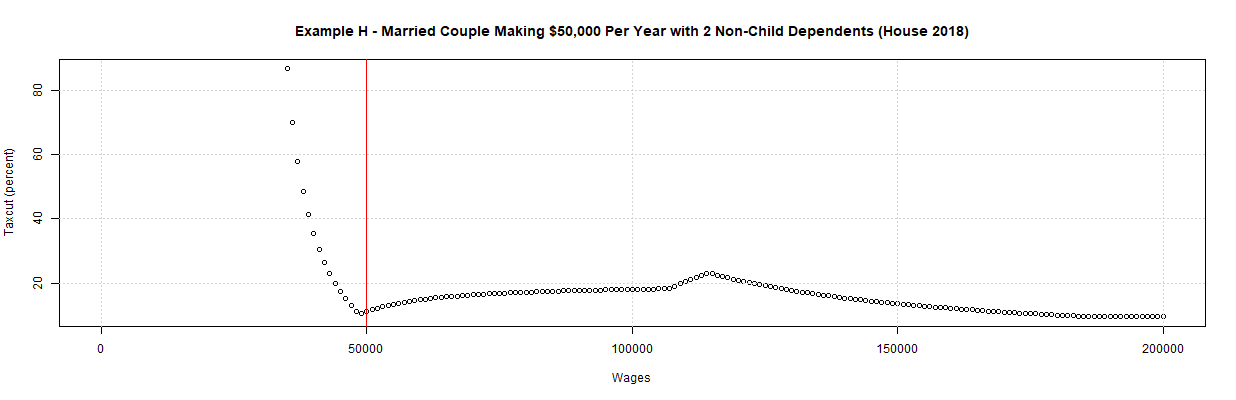
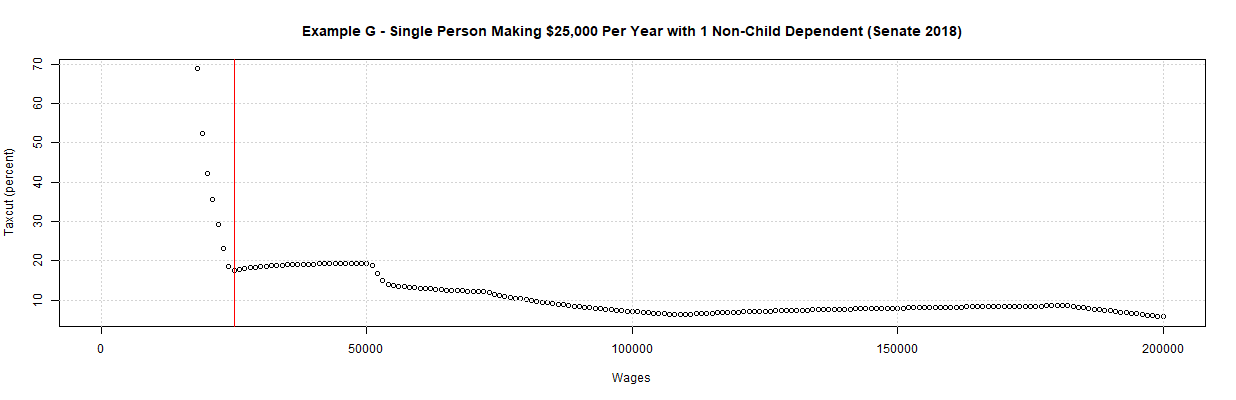
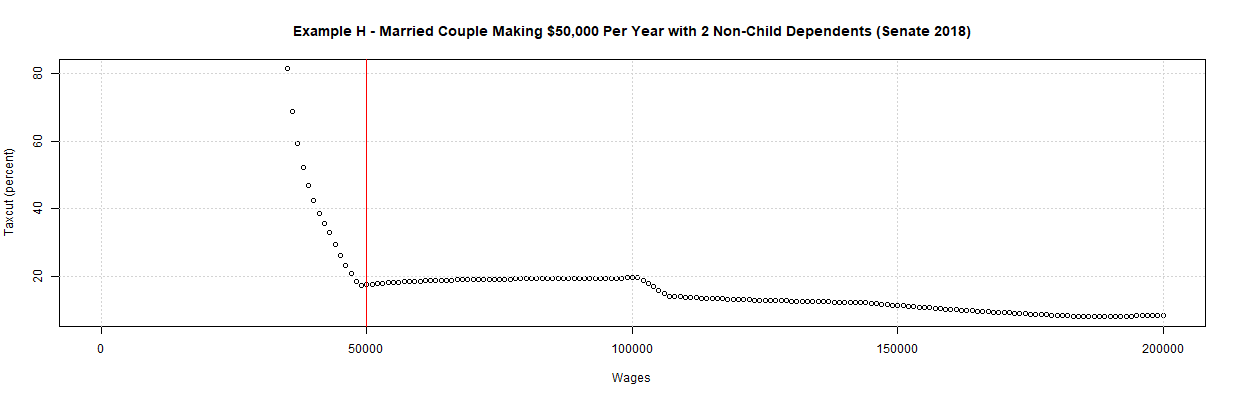
As can be seen from the plots, both tax plans provide tax cuts for these two cases for all incomes up through at least $200,0000. However, the Family Credit of $300 under the House plan is currently scheduled to expire in 5 years. For this reason, it makes sense to look at the House Plan without Family Credits. It also makes sense to look at the effect of the tax plans on families with additional non-child dependents since these families exist. The following tables show the effect of the tax plans on single taxpayers with 1 to 3 non-child dependents and on married couples with 1 to 6 non-child dependents.
Example G - Single Person Making $25,000 Per Year with N Non-Child Dependent             Example H - Married Couple Making $50,000 Per Year with N Non-Child Dependents

House                                     Senate                                         House                                    Senate

   Non-Child   Tax Cut(-)   w/o Family       Non-Child   Tax Cut(-)                         Non-Child   Tax Cut(-)  w/o Family       Non-Child   Tax Cut(-)
  Dependents  or Increase      Credits      Dependents  or Increase                        Dependents  or Increase     Credits      Dependents  or Increase
           1    -11.17438     45.76512               1    -17.48517                                 1    -20.43956    12.52747               1    -17.98535
           2      5.123967   153.8843                2    -38.92562                                 2    -11.17438    45.76512               2    -17.48517
           3     76.84211    708.4211                3   -168.6842                                  3     -3.261538   89.04615               3    -23.75385
                                                                                                    4      5.123967  153.8843                4    -38.92562
                                                                                                    5     22.26415   286.4151                5    -69.93711
                                                                                                    6     76.84211   708.4211                6   -168.6842
As can be seen in the first and third tables, elimination of the Family Credit causes tax cuts to become tax increases in the House bill. These increases get larger with additional non-child dependents. With the Family Credits, the House bill provides a tax cut for a single payer with one non-child dependent and for a married couple with up to 3 non-child dependents. However, additional non-child dependents beyond this cause the tax cuts to become tax increases.
Under the Senate bill, both single and married taxpayers appear to get a tax cut with any number of non-child dependents. In fact, the percentage of the tax cut grows as the number of non-child dependents grow. This would suggest that the $500 Family Credit in the Senate bill is large enough to make up for the loss of the exemption but the $300 Family Credit in the House bill is not. This actually makes sense since the exemption amount for 2018 is $4,150. Multiplying this by the 12 percent rate paid by the above examples gives $498. Hence, the House bill $300 Family Credit in the House bill is far too small to compensate for the loss of the exemption but the $500 Family Credit in the Senate bill is large enough. The brackets in the Senate bill also help in that the first $9,525 for single taxpayers and $19,050 for married taxpayers is taxed at 10 percent.
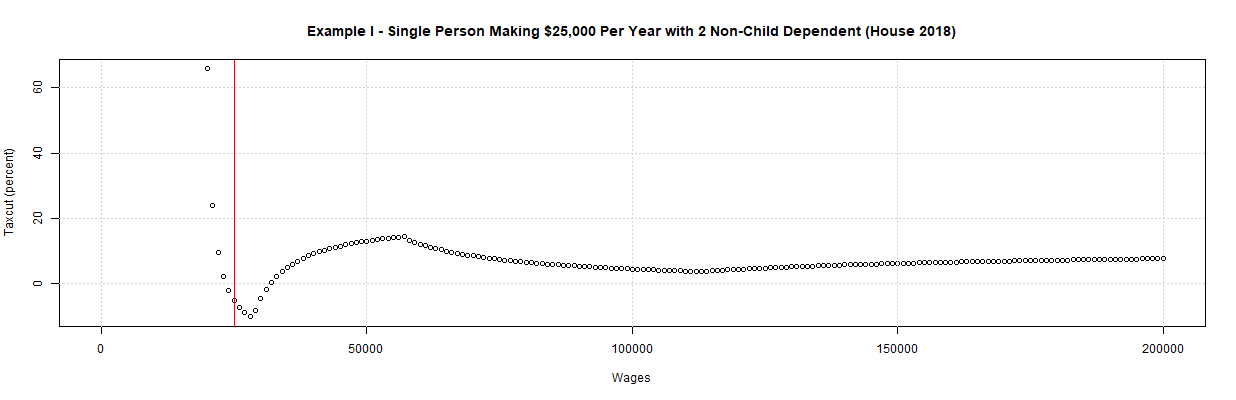
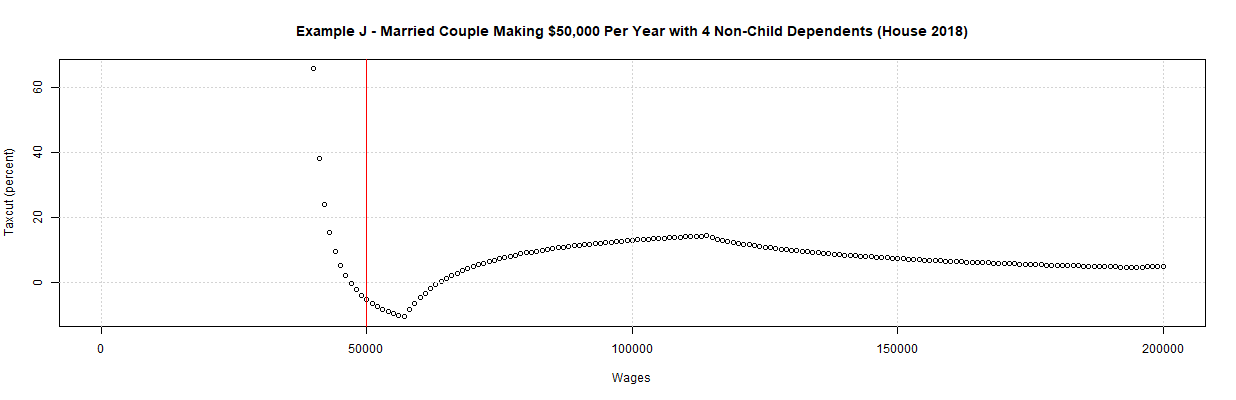
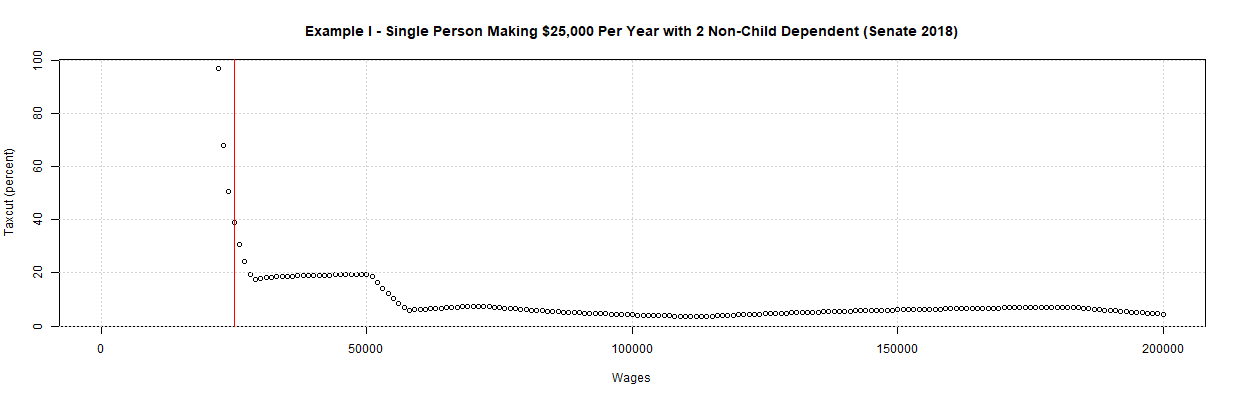
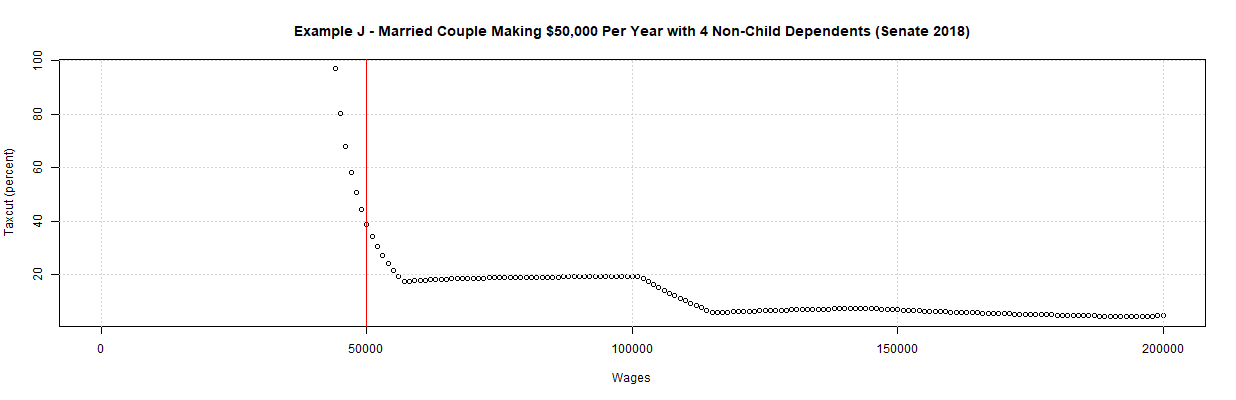
Example I was created from Example G by increasing the number of non-child dependents from 1 to 2. Similarly, Example J was created from Example H by increasing the number of non-child dependents from 2 to 4. The following tables and plots were generated by selecting these two new examples in the same interactive application.
Example I - Single Person Making $25,000 Per Year with 2 Non-Child Dependent             Example J - Married Couple Making $50,000 Per Year with 4 Non-Child Dependents

House                              Senate                                                House                              Senate
         Names      Taxes                   Names      Taxes                                      Names       Taxes                  Names      Taxes
1 Current 2018 605.000000          1 Current 2018  605.00000                             1 Current 2018 1210.000000         1 Current 2018 1210.00000
2   House 2018 636.000000          2  Senate 2018  369.50000                             2   House 2018 1272.000000         2  Senate 2018  739.00000
3       Change  31.000000          3       Change -235.50000                             3       Change   62.000000         3       Change -471.00000
4     % Change   5.123967          4     % Change  -38.92562                             4     % Change    5.123967         4     % Change  -38.92562
As mentioned in my prior post, the biggest concern raised by the House bill is likely the higher taxes that they represent to some lower income taxpayers in the first year and to many more lower income taxpayers in future years. The Senate bill has similar problems.
In any event, the above tables and plots do show several cases in which certain groups of taxpayers will immediately pay higher taxes. The plots for Examples A and B show that taxpayers who currently have deductions as large as the new standard deductions (about $12,000 for single and $24,000 for married) will likely pay more if their incomes are below about $37,500 for single and $75,000 for married. For the Senate, these incomes look to be closer to $40,000 and $80,000. The plots for Examples C and D show that taxpayers with the above-mentioned incomes that have additional deductions that are expiring on the order of $3,000 for single and $6,000 for married will see tax increases under both plans. The plots for Example E and F show that taxpayers with state and local income taxes that are 10 percent of their income will see tax increases above about $250,000 for single taxpayers. For married taxpayers, the tax increases will occur above incomes of about $350,000 for the House plan and $500,000 for the Senate plan. Example I and J and the preceding tables show that single taxpayers with two or more non-child dependents and married taxpayers with 4 or more non-child dependents will see tax increases. Examples I and J and the preceding tables show that some single taxpayers with two or more non-child dependents and married taxpayers with 4 or more non-child dependents will see tax increases under the House plan. Those taxpayers will have lower incomes, between about $25.000 and $30,000 for single and between about $50,000 and $60,000 for married. Under the Senate plan, however, these taxpayers will all see tax cuts.
It should be noted that these examples don't include a number of major components that should greatly favor taxpayers with higher income. As can be seen in this article, those components include repeal of the alternative minimum tax, a large tax cut for some “pass-through” income of individual business owners, and the large corporate tax cut. There's also the repeal of the estate tax which will chiefly benefit taxpayers of great wealth, if not great income. Hence, it would seem very possible that both plans are heavily tilted to those with high incomes and/or wealth. In any event, the examples show that there are a number of lower-income taxpayers who will see their taxes increase. There are also a number of higher-income taxpayers who will see their taxes increase due to the elimination of the deduction for state and local income taxes.
The Problems with "Taxpayer Examples"


ReplyDeleteI really like your writing style, superb information, thanks for putting up