Recent and Projected Federal Outlays and Their Role in Deficits
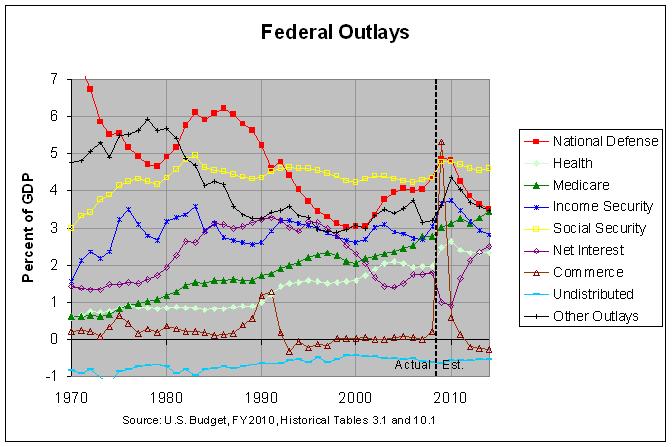
The first graph in my prior post shows that total outlays rose from about 18 and a half percent of GDP in 2000 to about 21 percent of GDP in 2008 and, after a large spike in 2009, are projected to continue at about 22 percent of GDP through 2014. As a help in determining the cause of this rise in outlays, following is a more detailed version of the second graph in that post:
In addition, following is a table that shows the change in the nine major components of actual federal outlays from 2000 to 2008 and of projected federal outlays from 2008 to 2014:
The actual numbers used to create this graph and table can be found at this link. As can be seen, total outlays rose about 2.5% of GDP from 2000 to 2008 and are projected to rise another 0.9% of GDP from 2008 to 2014. Following is a short summary of each of the nine components of federal outlays, listed in decreasing order of their size over the entire period from 2000 to 2014:
1) Medicare rose about 0.7% of GDP from 2000 to 2008 and is projected to rise another 0.7% of GDP from 2008 to 2014. Hence, it is projected to rise a total of 1.4% of GDP over the entire 14-year period.
2) Health is projected to rise about half as much as Medicare, a total of about 0.7% of GDP over the entire 14-year period.
3) National Defense spending rose about 1.3% of GDP from 2000 to 2008 but is projected to decrease about 0.8% of GDP from 2008 to 2014. That is the total increase of about 0.5% of GDP.
4) All other outlays rose about 0.13% of GDP from 2000 to 2008 and are projected to rise about 0.29% GDP from 2008 to 2014. That is a total increase of about 0.42% of GDP. The 3-line table at the bottom of this page shows that Veterans Benefits, International Affairs, and Education are the leading contributors at about 0.24, 0.17, and 0.15 percent of GDP, respectively.
5) Social Security rose about 0.12% of GDP and is projected to rise about 0.26% of GDP for a total increase of about 0.38% of GDP.
6) Net Interest dropped about 0.5% of GDP but is projected to rise back about 0.7% of GDP for a total increase of about 0.2% of GDP.
7) Income Security rose about 0.4% of GDP but is projected to drop back about 0.2% of GDP for a total increase of about 0.2% of GDP.
8) Undistributed Offsetting Receipts dropped about 0.17% of GDP but is projected to rise about 0.06% of GDP for for a total decrease of about 0.1% of GDP.
9) Commerce and Housing Credit rose about 0.16% of GDP but is projected to drop about 0.48% of GDP for a total decrease of about 0.32% of GDP.
Both the above graph and table show that Medicare and Health are projected to be the largest contributors to the increase in federal outlays. Together, they are projected to comprise about 63 percent of the total increase from 2000 to 2014. Page 171 of the Analytical Perspectives of the most recent U.S. Budget says the following on this topic:
The health reforms proposed in this budget are the key to achieving long-run fiscal stability. Without significant health reform it will be impossible to rein in Federal spending as required for fiscal stabilization, since in the absence of reform the Government’s major health programs – Medicare and Medicaid – are projected to be the most rapidly growing programs in the budget by a large margin. A successful health reform that slows the growth of per capita health care costs is also the essential ingredient for expanding health insurance coverage without permanently adding to the projected level of long-run spending.
In addition, the above graph and table show that Net Interest is projected to be the largest contributor from just 2008 to 2014. On this, page 174 of the Analytical Perspectives says the following:
Interest rates on Treasury securities fell sharply in late 2008, which brought both short-term and long-term rates to their lowest levels in decades. So far in 2009, short-term Treasury rates have remained near zero, and the ten-year yield remains near 3 percent. Investors have sought the security of Treasury debt during the heightened financial uncertainty of the last several months. In the projection period, interest rates are expected to rise as financial concerns are alleviated and the economy recovers from recession. The 91-day Treasury bill rate is projected to reach 4.0 percent and the 10-year rate 5.2 percent by 2013, at which point unemployment will have reached its long-run value and the annual growth rate of real GDP will have stabilized at 2.6 percent. These forecast rates are historically low, reflecting lower inflation in the forecast than for most of the post World War II period. After adjusting for inflation, the projected real interest rates are close to their historical averages.
In addition, following is a table that shows the change in the nine major components of actual federal outlays from 2000 to 2008 and of projected federal outlays from 2008 to 2014:
                         CHANGE IN FEDERAL OUTLAYS (percentage of GDP)

                                                            Commerce  Undist.
      National                     Income   Social      Net & Housing Offsetng   Other    Total
Years  Defense   Health Medicare Security Security Interest   Credit Receipts  Outlays  Outlays
----- -------- -------- -------- -------- -------- -------- -------- -------- -------- --------
00-08    1.300    0.382    0.717    0.419    0.121   -0.519    0.163   -0.168    0.129    2.544
08-14*  -0.825    0.348    0.711   -0.223    0.260    0.725   -0.485    0.064    0.293    0.869
----- -------- -------- -------- -------- -------- -------- -------- -------- -------- --------
00-14*   0.474    0.730    1.428    0.196    0.381    0.206   -0.322   -0.104    0.422    3.413

* estimated
The actual numbers used to create this graph and table can be found at this link. As can be seen, total outlays rose about 2.5% of GDP from 2000 to 2008 and are projected to rise another 0.9% of GDP from 2008 to 2014. Following is a short summary of each of the nine components of federal outlays, listed in decreasing order of their size over the entire period from 2000 to 2014:
1) Medicare rose about 0.7% of GDP from 2000 to 2008 and is projected to rise another 0.7% of GDP from 2008 to 2014. Hence, it is projected to rise a total of 1.4% of GDP over the entire 14-year period.
2) Health is projected to rise about half as much as Medicare, a total of about 0.7% of GDP over the entire 14-year period.
3) National Defense spending rose about 1.3% of GDP from 2000 to 2008 but is projected to decrease about 0.8% of GDP from 2008 to 2014. That is the total increase of about 0.5% of GDP.
4) All other outlays rose about 0.13% of GDP from 2000 to 2008 and are projected to rise about 0.29% GDP from 2008 to 2014. That is a total increase of about 0.42% of GDP. The 3-line table at the bottom of this page shows that Veterans Benefits, International Affairs, and Education are the leading contributors at about 0.24, 0.17, and 0.15 percent of GDP, respectively.
5) Social Security rose about 0.12% of GDP and is projected to rise about 0.26% of GDP for a total increase of about 0.38% of GDP.
6) Net Interest dropped about 0.5% of GDP but is projected to rise back about 0.7% of GDP for a total increase of about 0.2% of GDP.
7) Income Security rose about 0.4% of GDP but is projected to drop back about 0.2% of GDP for a total increase of about 0.2% of GDP.
8) Undistributed Offsetting Receipts dropped about 0.17% of GDP but is projected to rise about 0.06% of GDP for for a total decrease of about 0.1% of GDP.
9) Commerce and Housing Credit rose about 0.16% of GDP but is projected to drop about 0.48% of GDP for a total decrease of about 0.32% of GDP.
Both the above graph and table show that Medicare and Health are projected to be the largest contributors to the increase in federal outlays. Together, they are projected to comprise about 63 percent of the total increase from 2000 to 2014. Page 171 of the Analytical Perspectives of the most recent U.S. Budget says the following on this topic:
The health reforms proposed in this budget are the key to achieving long-run fiscal stability. Without significant health reform it will be impossible to rein in Federal spending as required for fiscal stabilization, since in the absence of reform the Government’s major health programs – Medicare and Medicaid – are projected to be the most rapidly growing programs in the budget by a large margin. A successful health reform that slows the growth of per capita health care costs is also the essential ingredient for expanding health insurance coverage without permanently adding to the projected level of long-run spending.
In addition, the above graph and table show that Net Interest is projected to be the largest contributor from just 2008 to 2014. On this, page 174 of the Analytical Perspectives says the following:
Interest rates on Treasury securities fell sharply in late 2008, which brought both short-term and long-term rates to their lowest levels in decades. So far in 2009, short-term Treasury rates have remained near zero, and the ten-year yield remains near 3 percent. Investors have sought the security of Treasury debt during the heightened financial uncertainty of the last several months. In the projection period, interest rates are expected to rise as financial concerns are alleviated and the economy recovers from recession. The 91-day Treasury bill rate is projected to reach 4.0 percent and the 10-year rate 5.2 percent by 2013, at which point unemployment will have reached its long-run value and the annual growth rate of real GDP will have stabilized at 2.6 percent. These forecast rates are historically low, reflecting lower inflation in the forecast than for most of the post World War II period. After adjusting for inflation, the projected real interest rates are close to their historical averages.


Comments
Post a Comment