Federal Outlays since 1940 and Their Role in Deficits
There has been a great deal of discussion about the role of spending in the current and past deficits of the federal government. Since the most commonly referenced deficit, the unified deficit, is equal to federal revenues minus federal outlays, deficits are affected by all items that affect revenues and outlays. These items include tax rates, economic activity, and spending. Regarding spending, I have posted a number of graphs and tables that look at spending from 1940 to 2014 at the following links:
Outlays in Billions of Current Dollars
Outlays as a Percentage of GDP
The following graph shows total federal outlays and receipts since 1940:
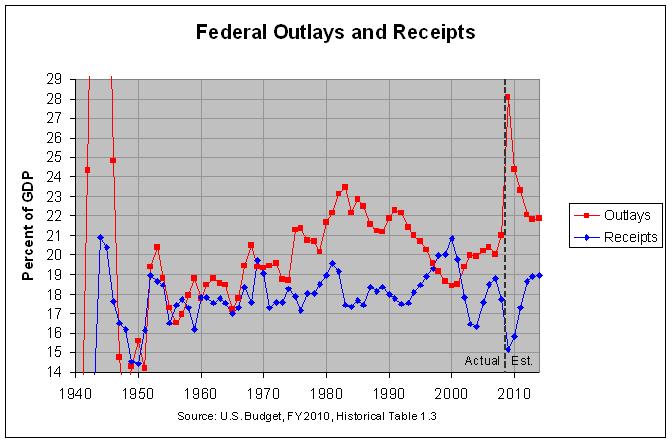
The actual numbers used to create this graph can be found at the second link. As can be seen, total receipts have mostly been in the 17% to 19% of GDP range in the 54 years since 1954. They have only dipped below 17% of GDP in five years, reaching a low of 16.1% of GDP in 1959 and they have risen above 19% in just nine years, reaching a high of 20.9% of GDP in 2000. However, they are projected to dip below the prior low in 2009, reaching a new low of 15.1% of GDP.
Outlays have been less stable. They were likewise in the 17% to 19% of GDP range for all but two years from 1954 through 1966. However, they then began to rise steadily, reaching a high of 23.5% of GDP in 1983. From there, they began a long decline, finally getting back in the 17% to 19% of GDP range in 1999 through 2001. However, they have now risen back to nearly 21% of GDP in 2008. Hence, one could argue that a major contributor to deficits was the steady increase in spending from 1966 to 1983 and from 2000 to 2008 with no corresponding increases in receipts. However, these deficits were also exasperated by the sharp drop in receipts from 1981 to 1983 and from 2000 to 2004 and were relieved by the growth in receipts from 1992 to 2000 and from 2004 to 2007.
The second link above shows outlays as a percentage of GDP. This is a useful measure of the stability (or lack thereof) of the growth in receipts and outlays. Because wages tend to grow at the same rate as the GDP, receipts tend to remain at the same percentage of GDP, given that tax rates and economic activity stay at the same relative level. If outlays can likewise be kept at the same percentage of GDP, then the budget can be kept at the same level of balance.
The following graph shows nine major components of federal outlays:
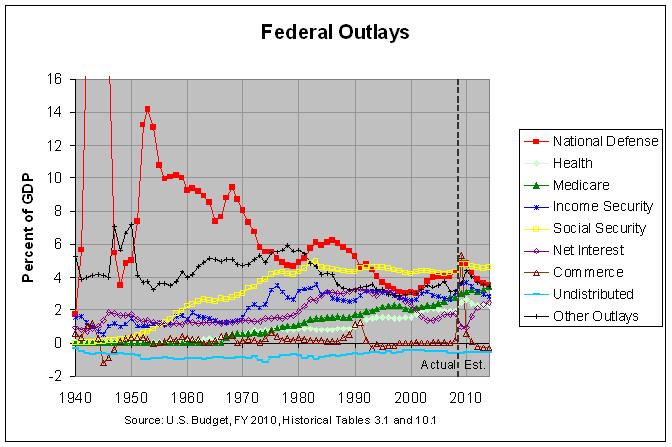
The actual numbers for this graph can be found at the second link. In any event, following is a short summary of each of the nine components:
1) National Defense spending has been generally decreasing, going from 13.1% of GDP in 1954 to 4.3% of GDP in 2008. There were increases from 1979 to 1986 and from 1999 to 2008 but the overall trend has been down.
2) Social Security rose from 0.9% of GDP in 1954 to almost 5% of GDP in 1983 but it has since dropped back slightly to 4.3% of GDP.
3) Medicare has risen fairly steadily since its inception in 1967, reaching 2.7% of GDP in 2008.
4) Health (of which Medicaid grants comprised 71% in 2006) rose from under 0.1% of GDP in 1954 to nearly 1% of GDP in 1979 but stabilized at that level through 1990. From there, it began to rise, reaching nearly 2% of GDP in 2008.
5) Income Security consists of General and Federal Retirement and Disability, Unemployment Compensation, and Housing, Food and Nutrition, and Other Income Assistance. It was between 1 and 2 percent of GDP from 1949 through 1970, rose to 3.2% of GDP by 1975, and has been between 2.5 and 3.6 percent of GDP since then.
6) Net interest was between 1 and 2 percent of GDP from 1944 through 1980, rose to about 3% of GDP from 1985 through 1997, and has now dropped back to the 1 to 2 percent level.
7) Commerce and Housing Credit has been relatively small (less than 0.7% of GDP) since 1948 except for when it rose to over 1% of GDP in 1990 and 1991. This was due to an increase in Deposit Insurance spending to pay for the Savings and Loans bailout. In addition, it is projected to soar to 5.3% of GDP in 2009 as a result of the recent financial bailout.
8) Undistributed Offsetting Receipts consist chiefly of the payments federal agencies make to retirement trust funds for their employees and are counted as negative outlays. They have gone from about -1% of GDP in 1952 to -0.6% of GDP now.
9) All other outlays rose from 3.3% of GDP in 1954 to 5.9% of GDP in 1978 but dropped to a low of 2.9% of GDP by 1997. Since then, they have risen back to 3.2% of GDP. The third and fourth graphs at this link show a further breakdown of this other outlays category.
Outlays in Billions of Current Dollars
Outlays as a Percentage of GDP
The following graph shows total federal outlays and receipts since 1940:
The actual numbers used to create this graph can be found at the second link. As can be seen, total receipts have mostly been in the 17% to 19% of GDP range in the 54 years since 1954. They have only dipped below 17% of GDP in five years, reaching a low of 16.1% of GDP in 1959 and they have risen above 19% in just nine years, reaching a high of 20.9% of GDP in 2000. However, they are projected to dip below the prior low in 2009, reaching a new low of 15.1% of GDP.
Outlays have been less stable. They were likewise in the 17% to 19% of GDP range for all but two years from 1954 through 1966. However, they then began to rise steadily, reaching a high of 23.5% of GDP in 1983. From there, they began a long decline, finally getting back in the 17% to 19% of GDP range in 1999 through 2001. However, they have now risen back to nearly 21% of GDP in 2008. Hence, one could argue that a major contributor to deficits was the steady increase in spending from 1966 to 1983 and from 2000 to 2008 with no corresponding increases in receipts. However, these deficits were also exasperated by the sharp drop in receipts from 1981 to 1983 and from 2000 to 2004 and were relieved by the growth in receipts from 1992 to 2000 and from 2004 to 2007.
The second link above shows outlays as a percentage of GDP. This is a useful measure of the stability (or lack thereof) of the growth in receipts and outlays. Because wages tend to grow at the same rate as the GDP, receipts tend to remain at the same percentage of GDP, given that tax rates and economic activity stay at the same relative level. If outlays can likewise be kept at the same percentage of GDP, then the budget can be kept at the same level of balance.
The following graph shows nine major components of federal outlays:
The actual numbers for this graph can be found at the second link. In any event, following is a short summary of each of the nine components:
1) National Defense spending has been generally decreasing, going from 13.1% of GDP in 1954 to 4.3% of GDP in 2008. There were increases from 1979 to 1986 and from 1999 to 2008 but the overall trend has been down.
2) Social Security rose from 0.9% of GDP in 1954 to almost 5% of GDP in 1983 but it has since dropped back slightly to 4.3% of GDP.
3) Medicare has risen fairly steadily since its inception in 1967, reaching 2.7% of GDP in 2008.
4) Health (of which Medicaid grants comprised 71% in 2006) rose from under 0.1% of GDP in 1954 to nearly 1% of GDP in 1979 but stabilized at that level through 1990. From there, it began to rise, reaching nearly 2% of GDP in 2008.
5) Income Security consists of General and Federal Retirement and Disability, Unemployment Compensation, and Housing, Food and Nutrition, and Other Income Assistance. It was between 1 and 2 percent of GDP from 1949 through 1970, rose to 3.2% of GDP by 1975, and has been between 2.5 and 3.6 percent of GDP since then.
6) Net interest was between 1 and 2 percent of GDP from 1944 through 1980, rose to about 3% of GDP from 1985 through 1997, and has now dropped back to the 1 to 2 percent level.
7) Commerce and Housing Credit has been relatively small (less than 0.7% of GDP) since 1948 except for when it rose to over 1% of GDP in 1990 and 1991. This was due to an increase in Deposit Insurance spending to pay for the Savings and Loans bailout. In addition, it is projected to soar to 5.3% of GDP in 2009 as a result of the recent financial bailout.
8) Undistributed Offsetting Receipts consist chiefly of the payments federal agencies make to retirement trust funds for their employees and are counted as negative outlays. They have gone from about -1% of GDP in 1952 to -0.6% of GDP now.
9) All other outlays rose from 3.3% of GDP in 1954 to 5.9% of GDP in 1978 but dropped to a low of 2.9% of GDP by 1997. Since then, they have risen back to 3.2% of GDP. The third and fourth graphs at this link show a further breakdown of this other outlays category.


Comments
Post a Comment