Real GDP Growth
On January 30th, the Bureau of Economic Analysis issued its initial estimates of the real gross domestic product in the fourth quarter of 2008. Following is the beginning of the accompanying news release:
Real gross domestic product -- the output of goods and services produced by labor and property located in the United States -- decreased at an annual rate of 3.8 percent in the fourth quarter of 2008, (that is, from the third quarter to the fourth quarter), according to advance estimates released by the Bureau of Economic Analysis. In the third quarter, real GDP decreased 0.5 percent.
The Bureau emphasized that the fourth-quarter “advance” estimates are based on source data that are incomplete or subject to further revision by the source agency (see the box on page 4). The fourth- quarter “preliminary” estimates, based on more comprehensive data, will be released on February 27, 2009.
The release goes on to describe the components that contributed to the decrease:
The decrease in real GDP in the fourth quarter primarily reflected negative contributions from exports, personal consumption expenditures, equipment and software, and residential fixed investment that were partly offset by positive contributions from private inventory investment and federal government spending. Imports, which are a subtraction in the calculation of GDP, decreased.
Most of the major components contributed to the much larger decrease in real GDP in the fourth quarter than in the third. The largest contributors were a downturn in exports and a much larger decrease in equipment and software. The most notable offset was a much larger decrease in imports.
The BEA also released an updated spreadsheet containing the annual GDP figures since 1929 and quarterly GDP figures since 1947. The following graph shows the change in the annual real GDP figures since 1940:
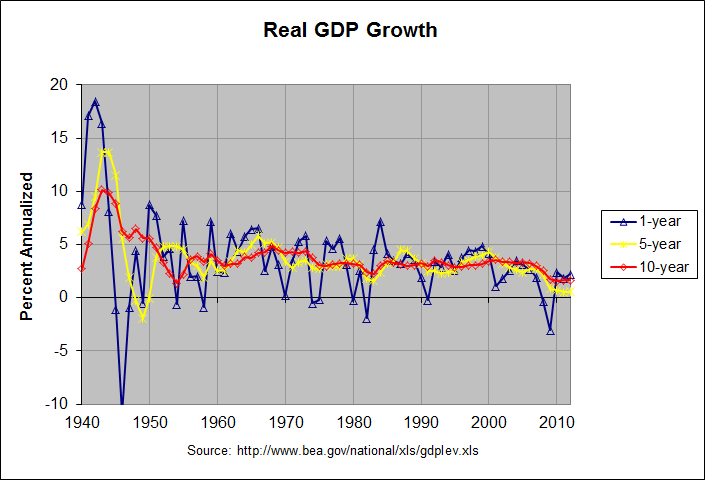
The actual numbers and sources for this and the following graph can be found at this link. The blue line shows the yearly change in the annual real GDP and the yellow and red lines show the 5-year and 10-year annualized changes, respectively. The following graph shows the change in the quarterly real GDP figures since 1960:
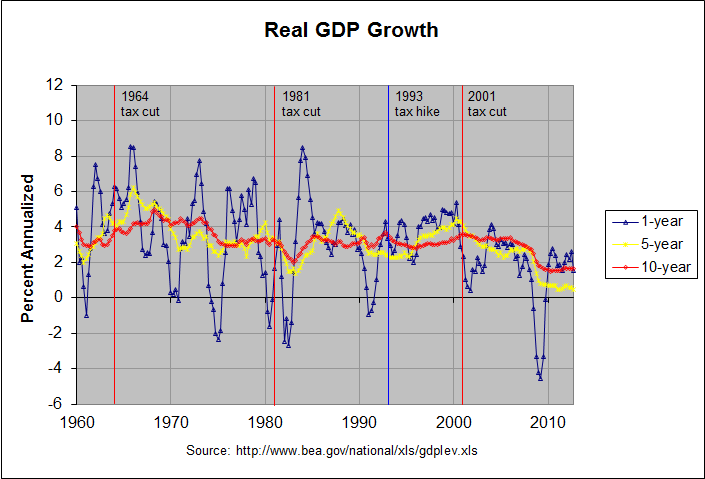
As before, the blue, yellow, and red lines show the 1-year, 5-year, and 10-year annualized changes in the quarterly real GDP. As can be seen, the 1-year change is the most volatile, the 5-year annualized change is less so, and the 10-year annualized change is even less so. In fact, the graph shows that the 10-year annualized change has been relatively stable since 1974, remaining between 2 and 4 percent for that entire period. Much of that apparent stability is due to the fact that 10 years just happen to be close to the length of several of the past business cycles. Recall that the prior three recessions were in 2001, 1990-91, and 1980-82. In fact, it is instructive to look at GDP growth over entire business cycles. The following table shows real GDP growth over all business cycles (taken from trough to trough) since 1949 as determined by the National Bureau of Economic Research:
                            REAL GDP GROWTH BY BUSINESS CYCLE

                GDP       GDP    Last Quarter          Entire Cycle
           (billion  (billion  ---------------- --------------------------
            current   chained  Percent  Annual-     # of  Percent  Annual-  Prior
Year  Qtr  dollars)   2000 $)   Change     ized Quarters   Change     ized  Trough   Trough
----  ---  --------  --------  -------  -------  -------  -------  -------  ------  -------
1949    4     265.2    1629.9     -1.0     -4.0
1954    2     376.0    2044.3      0.1      0.4       18     25.4     5.16  1949q4   1954q2
1958    2     458.1    2243.4      0.6      2.4       16      9.7     2.35  1954q2   1958q2
1961    1     527.9    2491.2      0.6      2.4       11     11.0     3.88  1958q2   1961q1
1970    4    1052.9    3759.8     -1.1     -4.2       39     50.9     4.31  1961q1   1970q4
1975    1    1570.0    4237.6     -1.2     -4.7       17     12.7     2.85  1970q4   1975q1
1980    3    2786.6    5107.4     -0.2     -0.7       22     20.5     3.45  1975q1   1980q3
1982    4    3314.4    5189.8      0.1      0.4        9      1.6     0.71  1980q3   1982q4
1991    1    5888.0    7040.8     -0.5     -2.0       33     35.7     3.77  1982q4   1991q1
2001    4   10226.3    9910.0      0.4      1.6       43     40.8     3.23  1991q1   2001q4
2008    4   14264.6   11599.4     -1.0     -3.8       28     17.0     2.27  2001q4   2008q4*

* 2008, quarter 4 has not been identified as a trough. It is just the most recent quarter.
Some of the business cycles are arguably too short to provide meaningful data. The following table combines the shorter business cycles to remedy this:
                REAL GDP GROWTH BY BUSINESS CYCLE (shorter cycles combined)

                GDP       GDP    Last Quarter          Entire Cycle
           (billion  (billion  ---------------- --------------------------
            current   chained  Percent  Annual-     # of  Percent  Annual-  Prior
Year  Qtr  dollars)   2000 $)   Change     ized Quarters   Change     ized  Trough   Trough
----  ---  --------  --------  -------  -------  -------  -------  -------  ------  -------
1949    4     265.2    1629.9     -1.0     -4.0
1961    1     527.9    2491.2      0.6      2.4       45     52.8     3.84  1949q4   1961q1
1970    4    1052.9    3759.8     -1.1     -4.2       39     50.9     4.31  1961q1   1970q4
1980    3    2786.6    5107.4     -0.2     -0.7       39     35.8     3.19  1970q4   1980q3
1991    1    5888.0    7040.8     -0.5     -2.0       42     37.9     3.10  1980q3   1991q1
2001    4   10226.3    9910.0      0.4      1.6       43     40.8     3.23  1991q1   2001q4
2008    4   14264.6   11599.4     -1.0     -3.8       28     17.0     2.27  2001q4   2008q4
As can be seen, the table now contains 5 groups from 1949 to 2001, each containing one or more full business cycles and being about 10 or 11 years in length. The last span from 2001 to 2008 is technically not a full cycle since an ending trough has not yet been determined by NBER. Still, the annualized growth in real GDP for these groups agree pretty much with the 10-year change seen in the graphs above. Real GDP growth from 1949 to 1970 was around 4 percent and was generally slightly above 3 percent from 1970 to 2001.
Since 2001, however, real GDP growth has been almost a full percentage point less than it was from 1970 to 2001. As mentioned, this period does not yet represent a full business cycle. However, the annualized rate of growth is unlikely to get any better between now an what turns out to be the final trough. Of course, there are all sorts of possible reasons for this slower GDP growth. Still, the data appears to provide no evidence that the Bush tax cuts served to increase real GDP growth.
Note: There is a updated version of this post at this link.


sir.
ReplyDeletehye. i just want to ask if u mind helping me with my assignment.
the question is if we want to plot a business cycle diagram, which one we need to calculate the real GDP or the real GDP growth rate. i got mix up n don't really know which figure to calculate.
the data i need to calculate if from here http://www.adb.org/Documents/Books/Key_Indicators/2008/Country.asp
if u can help mind email me at
fdanumb@gmail.com
thx
I'm don't know the precise definition of a "business cycle diagram" but I would guess that it looks at real GDP growth. Over the long run, real GDP itself keeps increasing so it would not seem to be a good indicator of business cycles.
ReplyDeletehi i had a question, i am taking an economics class and they wanted us to find the annual nominal and real GDP in the U.S. from 1960 to 2009. can i get help looking for this information?
ReplyDeleteYou can find that information in this spreadsheet. If you should later forget the location, it's at the bottom of this page which is pointed to by the link between the two graphs above. The spreadsheet contains the annual nominal GDP (labelled GDP in billions of current dollars) and the real GDP (labelled GDP in billions of chained 2005 dollars) from 1929 through 2009 in the second and third columns. At this link, you can find the following definition of chained dollars:
ReplyDeleteChained dollars -- A measure used to express real prices. Real prices are those that have been adjusted to remove the effect of changes in the purchasing power of the dollar; they usually reflect buying power relative to a reference year. Prior to 1996, real prices were expressed in constant dollars, a measure based on the weights of goods and services in a single year, usually a recent year. In 1996, the U.S. Department of Commerce introduced the chained-dollar measure. The new measure is based on the average weights of goods and services in successive pairs of years. It is "chained" because the second year in each pair, with its weights, becomes the first year of the next pair. The advantage of using the chained-dollar measure is that it is more closely related to any given period covered and is therefore subject to less distortion over time.
It just occurred to me that it would be useful to know the source of the spreadsheet. On this page on the Bureau of Economic Analysis website, you'll find it pointed to at the top via the link labelled Current-dollar and "real" GDP.
ReplyDelete