BLS Reports Eighth Straight Month of Job Losses
The unemployment rate rose from 5.7 to 6.1 percent in August, and non-farm payroll employment continued to trend down (-84,000), the Bureau of Labor Statistics of the U.S. Department of Labor reported today. In August, employment fell in manufacturing and employment services, while mining and health care continued to add jobs. Average hourly earnings rose by 7 cents, or 0.4 percent, over the month.
The 6.1 percent unemployment rate is the highest since September of 2003 and is just slightly below the prior peak of 6.3 percent reached in June of 2003. One reason why the unemployment rate increased so much last month is revealed by the next paragraph in the Summary:
Unemployment (Household Survey Data)
The number of unemployed persons rose by 592,000 to 9.4 million in August, and the unemployment rate increased by 0.4 percentage point to 6.1 percent. Over the past 12 months, the number of unemployed persons has increased by 2.2 million and the unemployment rate has risen by 1.4 percentage points, with most of the increase occurring over the past 4 months. (See table A-1.)
How is it that the number of unemployed persons rose by 592 thousand in August when there was a loss of only 84 thousand non-farm payroll jobs? One reason is because the 592 thousand figure comes from the Household Survey and the 84 thousand figure comes from the Payroll Survey. Some of the differences between these two surveys are described at this link. According to the Household Survey, employment dropped by 342 thousand in August and the labor force increased by 250 thousand. Adding these two numbers together give an additional 592 thousand people unemployed. Dividing the current unemployed (9.376 million) by the size of the labor force (154.853 million) gives 6.1 percent, the current unemployment rate.
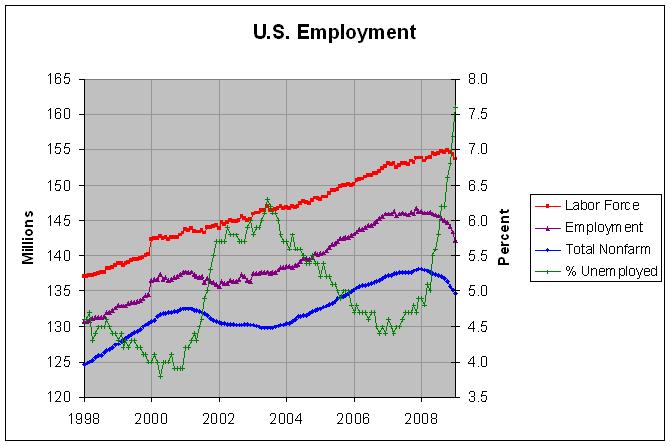
The following graph shows employment numbers from both of these surveys:

The total non-farm payroll numbers come from the Payroll Survey and the other numbers come from the Household Survey. The blue line shows that non-farm payroll has been declining since late 2007 (December was the high) but the purple line shows that employment according to the Household Survey has been fairly stagnant since late 2006. Its current level of 145.477 million is the lowest level since October of 2006. In any event, the green line shows the sharp increase in the unemployment rate over the past several months.
Job Growth Under Bush and Prior Presidents (through August 2008)
Comments
Post a Comment