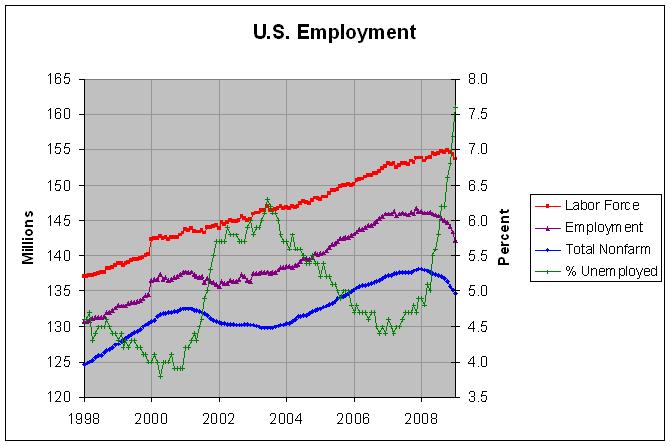
Employment from the BLS Household and Payroll Surveys
The unemployment rate actually dipped slightly from 4.9 percent to 4.8 percent, as 450,000 people left the labor force for any number of reasons. Economists thought many people probably gave up looking for work.
Another reason that the employment numbers and unemployment rate sometimes seem at odds is that they come from different surveys. The commonly referenced employment numbers are for nonfarm employment and come from the Payroll Survey whereas the labor force numbers and the unemployment rate come from the Household Survey. The Bureau of Labor Statistics give the following explanation for why there are two surveys on page 5 of the Employment Situation report:
The household survey and establishment survey both produce sample-based estimates of employment and both have strengths and limitations. The establishment survey employment series has a smaller margin of error on the measurement of month-to-month change than the household survey because of its much larger sample size. An over-the-month employment change of 104,000 is statistically significant in the establishment survey, while the threshold for a statistically significant change in the household survey is about 400,000. However, the household survey has a more expansive scope than the establishment survey because it includes the self-employed, unpaid family workers, agricultural workers, and private household workers, who are excluded by the establishment survey. The household survey also provides estimates of employment for demographic groups.
The following graph shows the employment numbers that have been reported since 1998 by the Household Survey (in purple) and the Payroll Survey (in blue):

The actual numbers and sources can be found at http://www.econdataus.com/employ08.html. There was much discussion about the merits of each survey back in 2002 and 2003. As can be seen from the graph, the Household Survey showed employment to be generally rising while the Payroll Survey showed employment continuing to drop for most of those two years. Regarding the differences between the two surveys, the Bureau of Labor Statistics puts out a report of the trends in both surveys. As shown in Chart 1 of that report, an adjustment can be made to the Household Survey to explain much of the apparent discrepancies between the surveys. On page 8, the report gives the following description of that adjustment:
This adjustment to household survey employment subtracts from total employment agriculture and related employment, nonagricultural self employed, unpaid family and private household workers, and workers on unpaid leave from their jobs, and then adds nonagricultural wage and salary multiple jobholders. It also smoothes out the effects of population control revisions to the survey in January of 2003-08.
It is possible that the payroll survey may sometimes lag the household survey. The survey trends report states the following:
The payroll survey sample does not include new firms immediately. They are incorporated with a lag. In the interim, a model-based estimate is used each month to account for employment resulting from new firm births.
Hence, the BLS does attempt to correct for this. Still, this lag effect may contribute to another discrepancy apparent in the graph above. Employment appears to be topping in the Payroll Survey with decreases occurring just the past two months. According to the Household Survey, however, employment has been relatively flat since last March. In fact, the just released February figures are 152 thousand below where they were last March according to the Household Survey. That is, no jobs have been created for nearly a full year according to that survey.
Comments
Post a Comment