The Decline in Spending Projected by the Bush Budgets
This has not been the first time that the Bush Administration has projected deep cuts in outlays that never came to pass. The following graph shows federal receipts and outlays as a percent of GDP since 1980:
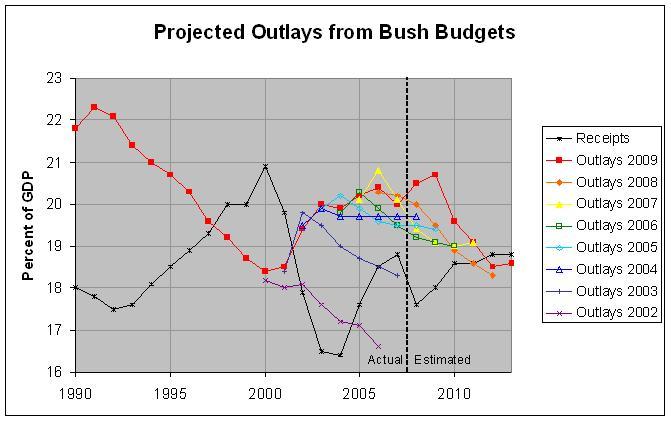
The actual numbers and sources are here. The red and black lines show the outlays and receipts from the most recent budget, the one for fiscal year 2009. The portions of these lines from 2008 on (to the right of the dotted line) are projections from the 2009 budget. The orange, yellow, green, sky blue, blue, indigo, and violet lines show the projections from the 2008 through 2002 budget, respectively. As can be seen from the red line, outlays as a percent of GDP have generally gone up since 2000 with small declines in 2004 and 2007. However, every prior Bush budget has projected a general decline in outlays over that period. The following table summarizes the periods during which outlays were projected to decline or stabilize in the Bush budgets:
Budget      First    Declining or
Fiscal  Projected  Steady Outlays
  Year       Year       Projected
------  ---------  --------------
  2002       2001       2002-2006
  2003       2002       2002-2007
  2004       2003       2003-2008
  2005       2004       2004-2009
  2006       2005       2005-2010
  2007       2006       2006-2010
  2008       2007       2006-2012
  2009       2008       2009-2012
As can be seen from the above graph, the Bush Administration's most recent projection is that outlays will decline rapidly from 20.7% of GDP in 2009 to 18.5% of GDP in 2012. This will be about equal to the low in outlays reached in 2000, before the War on Terror began and the prescription drug benefit (Medicare Part D) was implemented. Hence, this projection seems no more likely to occur than the projections from the prior seven budgets.
It may be tempting to blame the rise in outlays from 2000 to 2007 for the current deficits. However, the graph above shows that there was an even steeper decline in revenue from 2000 to 2004. In fact, the Bush Administration's Fiscal Year 2005 Mid-session Review conceded that the taxcuts played a role in the deficits. The pie chart on page 5 and Table 7 on page 28 of that report give the causes of the cumulative change in the federal budget from projected surpluses to actual deficits from 2001 through 2004. They show that 49 percent of this swing was due to reestimates, 29 percent was due to tax relief, and the remaining 22 percent was due to the war, homeland, and other spending. Hence, both the drop in revenues and the increase in spending have led to the current deficits.


Come on -10%
ReplyDelete