Mid-Session Review for Fiscal Year 2009
        RECEIPTS, OUTLAYS, DEFICITS, AND DEBTS (billions of dollars)

                            Actual  Estimate
                              2007   2008   2009   2010   2011   2012   2013
===========================  =====  =====  =====  =====  =====  =====  =====
Receipts...................   2568   2553   2651   2916   3084   3288   3439
Outlays....................   2730   2942   3133   3094   3187   3230   3410
---------------------------  -----  -----  -----  -----  -----  -----  -----
Unified deficit(-)/surplus.   -162   -389   -482   -178   -103     58     29
On-budget deficit..........   -343   -574   -663   -378   -321   -168   -172
Gross federal deficit......   -499   -672   -815   -505   -482   -375   -380

Debt held by the public....   5035   5421   5958   6137   6251   6208   6194
Debt held by gov't accounts   3916   4203   4480   4806   5175   5592   5986
---------------------------  -----  -----  -----  -----  -----  -----  -----
Gross federal debt.........   8951   9623  10438  10943  11425  11800  12180

          RECEIPTS, OUTLAYS, DEFICITS, AND DEBTS (percent of GDP)

                            Actual  Estimate
                              2007   2008   2009   2010   2011   2012   2013
===========================  =====  =====  =====  =====  =====  =====  =====
Receipts...................   18.8   17.9   17.9   18.7   18.7   18.9   18.9
Outlays....................   20.0   20.6   21.1   19.8   19.3   18.6   18.7
---------------------------  -----  -----  -----  -----  -----  -----  -----
Unified deficit(-)/surplus.   -1.2   -2.7   -3.3   -1.1   -0.6    0.3    0.2
On-budget deficit..........   -2.5   -4.0   -4.5   -2.4   -1.9   -1.0   -0.9
Gross federal deficit......   -3.7   -4.7   -5.5   -3.2   -2.9   -2.2   -2.1

Debt held by the public....   36.8   38.0   40.2   39.3   37.9   35.7   34.0
Debt held by gov't accounts   28.6   29.5   30.2   30.7   31.3   32.2   32.8
---------------------------  -----  -----  -----  -----  -----  -----  -----
Gross federal debt.........   65.5   67.5   70.4   70.0   69.2   67.9   66.8
As can be seen, the unified deficit is projected to reach $482 billion in 2009. In nominal dollars this is a record, surpassing the prior record of $413 billion reached in 2004. As a percent of GDP, however, the unified deficit will just reach 3.3 percent of GDP. This is far short of the prior post-World War II high of 6 percent of GDP reached in 1983.
However there's two serious problems with focusing on the unified deficit as an indicator of our financial condition. First of all, it doesn't include the monies that are being borrowed from the trust funds, chiefly Social Security. As the above table shows, the on-budget deficit is projected to be $663 billion in 2009. The on-budget deficit does includes the monies that are being borrowed from Social Security and the Postal Service. Including the monies being borrowed from ALL of the trust funds gives the gross federal deficit. This is the change in the gross federal debt and is projected to be $815 billion in 2009.
Secondly, and more importantly, we should be focusing on the debt not the deficit. It is the debt, not the deficit, that we will have to pay interest on forever (unless we pay it back). The only lasting significance of the deficit is that it is added to the debt. As the above table shows, the gross federal debt is projected to reach $10.438 trillion in 2009. That's 70.4 percent of GDP, far above the level of 39.9 percent of GDP that we reached in 1983 (see this link). It's even well above the prior high since 1955 of 67.3 percent of GDP reached in 1996. And the worst part is that we are 25 years closer to the Boomer retirement than we were in 1983. In fact, the first Boomers are just now eligible for early retirement and will be eligible for Medicare in just 3 years. Hence, we are arguably in much worse financial shape than we were back in 1983.
The following graph shows the projected deficits and debts as a percentage of GDP:
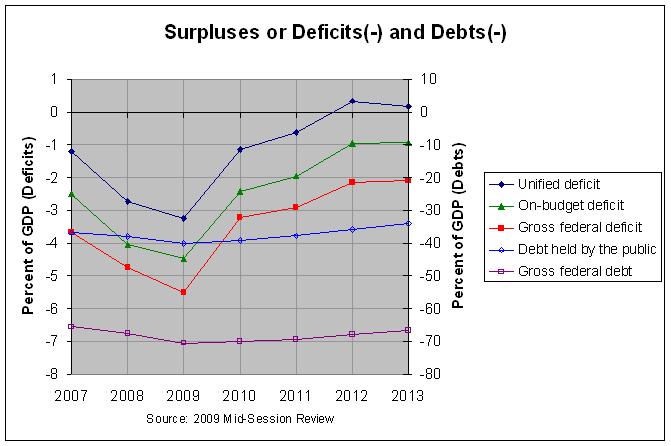
As can be seen, the gross federal debt as a percent of GDP is projected to start improving slightly after 2009 due to a rapidly improving deficit. However this link states that "the near-term balanced budget projections are illusory for the following reasons":
1. The projections fail to include war funding for Iraq and Afghanistan beyond mid-2009 -- which is highly unrealistic even assuming that a withdrawal from Iraq begins next year, as well as the bipartisan expectation that resources for operations in Afghanistan will have to increase.
2. The budget assumes only a one-year (2008) "patch" for the Alternative Minimum Tax (AMT), despite widespread expectations that AMT relief is likely to be provided in each of the next 5 years.
3. The Administration projections assume unrealistic deep cuts in nondefense discretionary programs that fund infrastructure, education, public health, disaster relief.
4. The near-term projections are based, in part, on Social Security surpluses--that will decline and disappear by 2017 as the boomers retire.
In any event, additional data from the Mid-Session Review can be found at this link.


Comments
Post a Comment