Who Will See Their Taxes Go Up under the Final GOP Tax Bill?
Taxpayer Examples Cited by Supporters of the Tax Bill
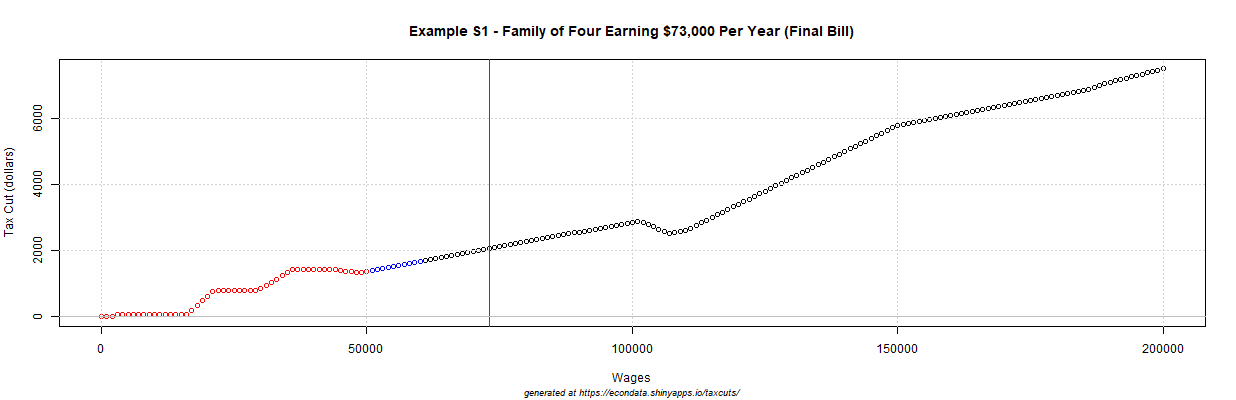
On December 15th, the GOP released its final tax plan. The Committee on Rules has posted a Summary of the bill, a Joint Explanatory Statement, and the full bill. In addition, House Speaker Ryan released an article that states that, with this bill, "the median family income of $73,000 will receive a tax cut of $2,059". This has been repeated many times since then, such as here, here, and here. In fact, this example is the first of three taxpayer examples that were released in November 21st by the Senate Committee on Finance. Following is information for this and the second example, as generated by the interactive application at this link:
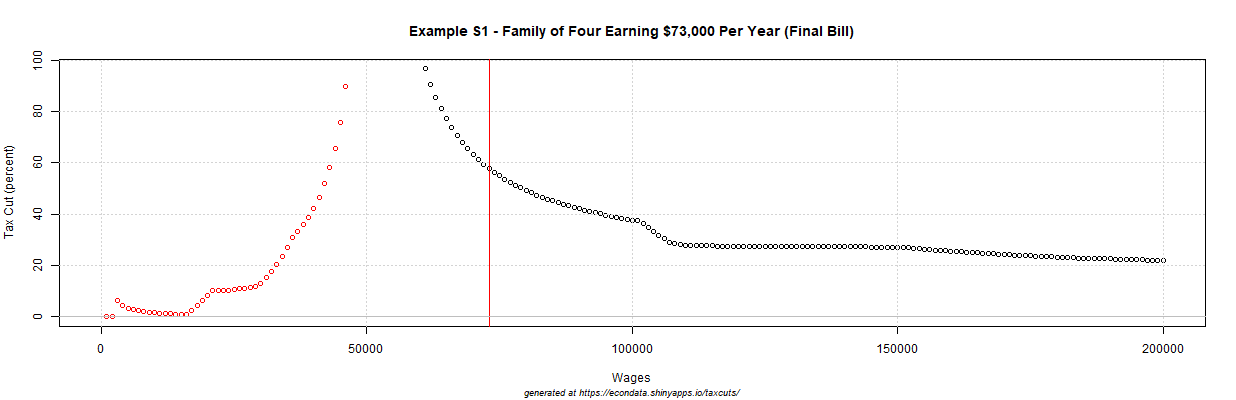
Example S1 - Family of Four Earning $73,000 Per Year

         Names     Taxes Released After_Tax
1 Current 2018  3,557.50          69,442.50
2   Conference  1,499.00          71,501.00
3       Change -2,058.50    -2059  2,058.50
4     % Change    -57.86               2.96
|
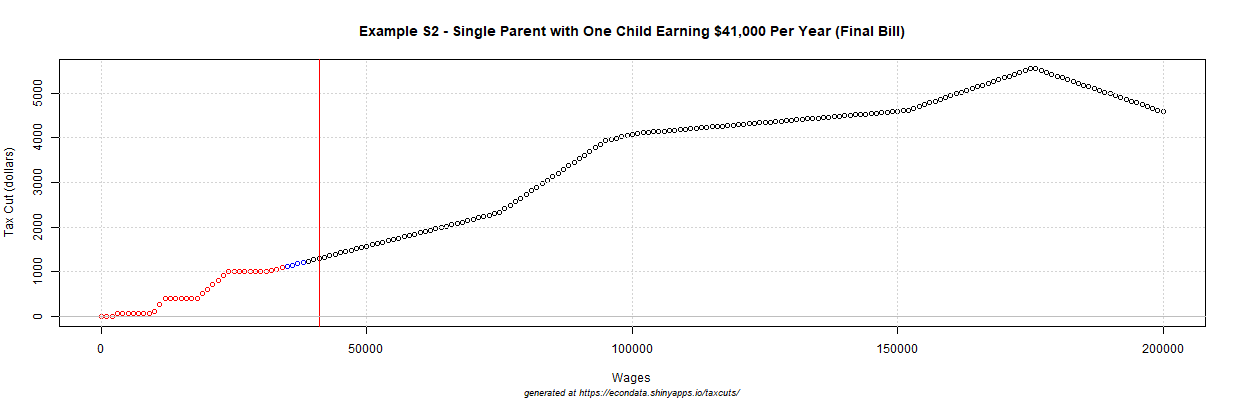
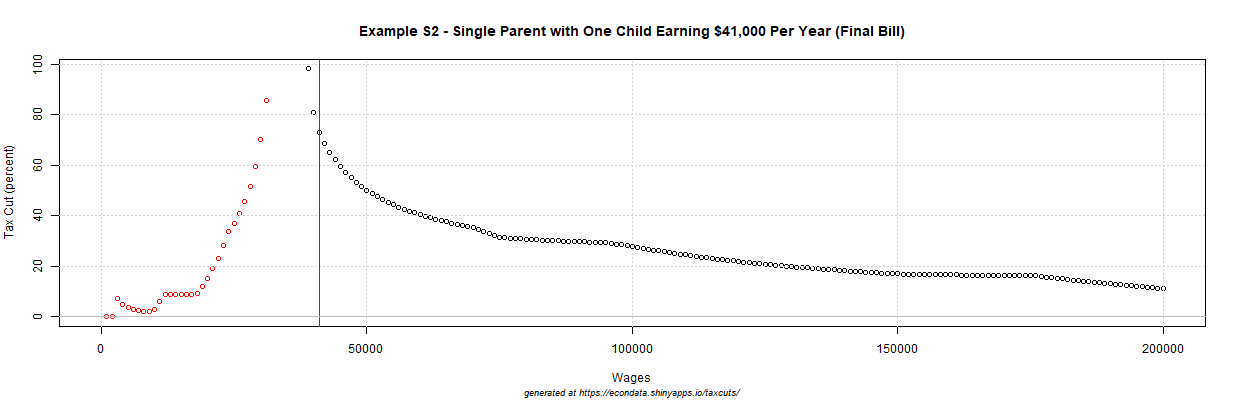
Example S2 - Single Parent with One Child Earning $41,000 Per Year

         Names     Taxes Released After_Tax
1 Current 2018  1,792.50          39,207.50
2   Conference    488.00          40,512.00
3       Change -1,304.50           1,304.50
4     % Change    -72.78               3.33
|
Example S1 - Family of Four Earning $73,000 Per Year

                      Tax Plan     2018 Conference   Change
1  --------------------------- --------   -------- --------
2  Wages, salaries, tips, etc.   73,000     73,000        0
3   Tax-deferred contributions        0          0        0
4                   Exemptions  -16,600          0   16,600
5          Standard deductions  -13,000    -24,000  -11,000
6          Itemized deductions        0          0        0
7  --------------------------- --------   -------- --------
8                      Medical        0          0        0
9        State and local taxes        0          0        0
10           Real estate taxes        0          0        0
11      Home mortgage interest        0          0        0
12                     Charity        0          0        0
13   Misc. repealed deductions        0          0        0
14 --------------------------- --------   -------- --------
15              Taxable income   43,400     49,000    5,600
16 --------------------------- --------   -------- --------
17       Tax on taxable income    5,558      5,499      -58
18                Child credit   -2,000     -4,000   -2,000
19      Other dependent credit        0          0        0
20               Parent credit        0          0        0
21    Earned income tax credit        0          0        0
22 --------------------------- --------   -------- --------
23                  Income tax    3,558      1,499   -2,058
24                 Payroll tax        0          0        0
25 --------------------------- --------   -------- --------
26                   Total tax    3,558      1,499   -2,058
|
Example S2 - Single Parent with One Child Earning $41,000 Per Year

                      Tax Plan     2018 Conference   Change
1  --------------------------- --------   -------- --------
2  Wages, salaries, tips, etc.   41,000     41,000        0
3   Tax-deferred contributions        0          0        0
4                   Exemptions   -8,300          0    8,300
5          Standard deductions   -9,550    -18,000   -8,450
6          Itemized deductions        0          0        0
7  --------------------------- --------   -------- --------
8                      Medical        0          0        0
9        State and local taxes        0          0        0
10           Real estate taxes        0          0        0
11      Home mortgage interest        0          0        0
12                     Charity        0          0        0
13   Misc. repealed deductions        0          0        0
14 --------------------------- --------   -------- --------
15              Taxable income   23,150     23,000     -150
16 --------------------------- --------   -------- --------
17       Tax on taxable income    2,792      2,488     -304
18                Child credit   -1,000     -2,000   -1,000
19      Other dependent credit        0          0        0
20               Parent credit        0          0        0
21    Earned income tax credit        0          0        0
22 --------------------------- --------   -------- --------
23                  Income tax    1,792        488   -1,304
24                 Payroll tax        0          0        0
25 --------------------------- --------   -------- --------
26                   Total tax    1,792        488   -1,304
|
|
|
|
|
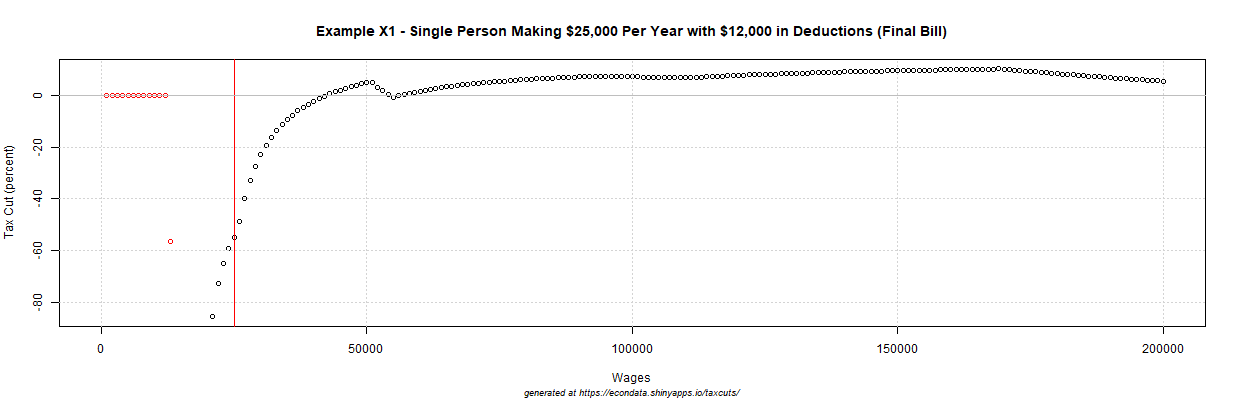
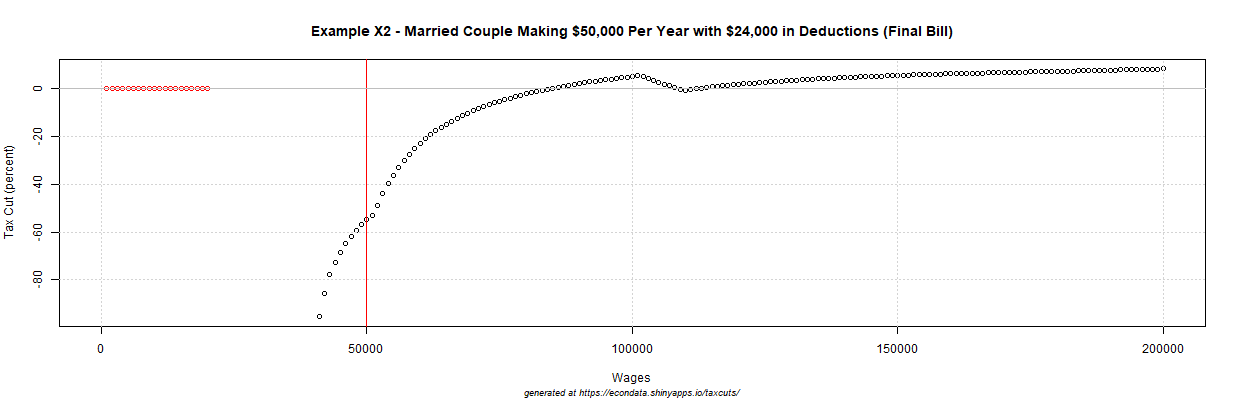
The above plots show the tax cut that will be received by taxpayers in both examples, in dollars and percentage, for all incomes up to $200,000. You can click on any of the plots above or following to see a fully expanded version of the plot. As can be seen, the incomes that were selected for the examples provided relatively large tax cuts when judged by percentage. Still, the plots show that all taxpayers with the same characteristics (married couple with 2 children and no deductions or single mother with one child and no deductions) will receive tax cuts under the final tax bill, at least up to an income of $200,000.
Taxpayers Who Have Deductions as Large as the New Standard Deduction
A natural question is whether there are taxpayers with different characteristics who won't all receive tax cuts. As suggested by my prior post, two of the oft-mentioned benefits of the tax bill are the doubling of the standard deduction and child tax credit. What if the taxpayer has characteristics such that they don't benefit from these provisions? The following two examples are for single and married taxpayers who have no children and who currently have deductions equal to the new standard deductions. Under these conditions, the taxpayers will not benefit from either the expanded child credit or the expanded standard deduction. However, they also won't be hurt by any deductions that are being eliminated since they will still get the amount of their deductions through the new standard deduction. Following are the two examples:
Example X1 - Single Person Making $25,000 Per Year with $12,000 in Deductions

         Names Taxes Released After_Tax
1 Current 2018   885             24,115
2   Conference 1,370             23,630
3       Change   484               -484
4     % Change    55                 -2
|
Example X2 - Married Couple Making $50,000 Per Year with $24,000 in Deductions

         Names Taxes Released After_Tax
1 Current 2018 1,770             48,230
2   Conference 2,739             47,261
3       Change   969               -969
4     % Change    55                 -2
|
Example X1 - Single Person Making $25,000 Per Year with $12,000 in Deductions

                      Tax Plan     2018 Conference   Change
1  --------------------------- --------   -------- --------
2  Wages, salaries, tips, etc.   25,000     25,000        0
3   Tax-deferred contributions        0          0        0
4                   Exemptions   -4,150          0    4,150
5          Standard deductions        0    -12,000  -12,000
6          Itemized deductions  -12,000          0   12,000
7  --------------------------- --------   -------- --------
8                      Medical        0          0        0
9        State and local taxes        0          0        0
10           Real estate taxes   -3,000     -3,000        0
11      Home mortgage interest   -9,000     -9,000        0
12                     Charity        0          0        0
13   Misc. repealed deductions        0          0        0
14 --------------------------- --------   -------- --------
15              Taxable income    8,850     13,000    4,150
16 --------------------------- --------   -------- --------
17       Tax on taxable income      885      1,370      484
18                Child credit        0          0        0
19      Other dependent credit        0          0        0
20               Parent credit        0          0        0
21    Earned income tax credit        0          0        0
22 --------------------------- --------   -------- --------
23                  Income tax      885      1,370      484
24                 Payroll tax        0          0        0
25 --------------------------- --------   -------- --------
26                   Total tax      885      1,370      484
|
Example X2 - Married Couple Making $50,000 Per Year with $24,000 in Deductions

                      Tax Plan     2018 Conference   Change
1  --------------------------- --------   -------- --------
2  Wages, salaries, tips, etc.   50,000     50,000        0
3   Tax-deferred contributions        0          0        0
4                   Exemptions   -8,300          0    8,300
5          Standard deductions        0    -24,000  -24,000
6          Itemized deductions  -24,000          0   24,000
7  --------------------------- --------   -------- --------
8                      Medical        0          0        0
9        State and local taxes        0          0        0
10           Real estate taxes   -6,000     -6,000        0
11      Home mortgage interest  -18,000    -18,000        0
12                     Charity        0          0        0
13   Misc. repealed deductions        0          0        0
14 --------------------------- --------   -------- --------
15              Taxable income   17,700     26,000    8,300
16 --------------------------- --------   -------- --------
17       Tax on taxable income    1,770      2,739      969
18                Child credit        0          0        0
19      Other dependent credit        0          0        0
20               Parent credit        0          0        0
21    Earned income tax credit        0          0        0
22 --------------------------- --------   -------- --------
23                  Income tax    1,770      2,739      969
24                 Payroll tax        0          0        0
25 --------------------------- --------   -------- --------
26                   Total tax    1,770      2,739      969
|

|

|
|
|
As can be seen in the plots, taxpayers in both examples will pay higher taxes if their incomes are below about $43,000 for the single taxpayer and about $85,000 for the married taxpayers. One thing to check, however, is how realistic those deductions are for various income levels. As can be seen in the calculation of the tax cuts above, the deductions were set to real estate taxes of $3,000 and mortgage interest of $9,000 for the single taxpayer and twice that for the married taxpayers filing jointly. These number were derived from taxpayer examples posted at this link by the Tax Foundation. The fifth household uses the example of a $340,000 home financed with a 30-year mortgage with 3.5 percent interest and 20 percent down and an effective property tax rate of 1 percent. This works out to mortgage interest of $9,520 ($340,000 * 0.8 * 0.035) and property tax of $3,400 ($340,000 * 0.01). Assuming a $300,000 home financed with a 30-year mortgage with 3.75 percent interest and 20 percent down will give mortgage interest of $9,000 ($300,000 * 0.8 * 0.0375). Assuming an effective property tax rate of 1 percent on that home will give a property tax of $3,000 ($300,000 * 0.01).
For the married couple, I just assume a $600,000 home with all of the same rates. That gives mortgage interest of $18,000 ($600,000 * 0.8 * 0.0375) and property tax of $6,000 ($600,000 * 0.01). Hence, these two examples could represent homeowners in any state, regardless of whether or not that state has state income taxes. For example, if the taxpayer did pay $1,000 in state income tax but $1,000 less in mortgage interest, the result would be exactly the same. In fact, it would even be the same if that $1,000 were instead for a deduction that has been repealed, say for moving expenses.
As the tables show, both examples result in a 55 percent tax increase. The plots show that for single taxpayers, taxes will increase between incomes of about $13,000 and $42,000 and for married couples, taxes will increase between incomes of about $25,000 and $84,000.
Taxpayers Who Have Deductions Larger than the New Standard Deduction
The results will be generally the same if the taxpayer has more deductions than the new standard deduction. To be precise, the above plots will appear to move to the right by the amount more than the standard deduction that is deductible. That is because the only real change is that the taxpayer's taxable income is lowered by that amount. However, the taxpayer will see a larger increase in taxes if some of those deductions have been repealed. Under the final tax bill, most lower income taxpayers should not have deductions that are repealed. That's because the major deductions (medical, state and local taxes, real estate taxes, mortgage interest, and charity) are still deductible with some limitations. Those limitations should likely not hit lower income taxpayers who have modest homes. For example, the married couple in the second example above could pay an 8% effective state income tax on their income of $50,000 and would just hit but not go over the limitation of $10,000 for combined state income and property tax.
However, repealed deductions could still be a problem for lower income taxpayers if they take any of the following deductions which have been repealed:
- Home equity indebtedness
- Personal Casualty and Theft Losses
- Miscellaneous Itemized Deductions Subject to the 2 Percent Floor including:
- Unreimbursed employee expenses
- Tax preparation expenses
- Safe deposit box rental
- Hobby expenses
- Investment fees and expenses
- Legal expenses
- Alimony payments
- Moving Expenses
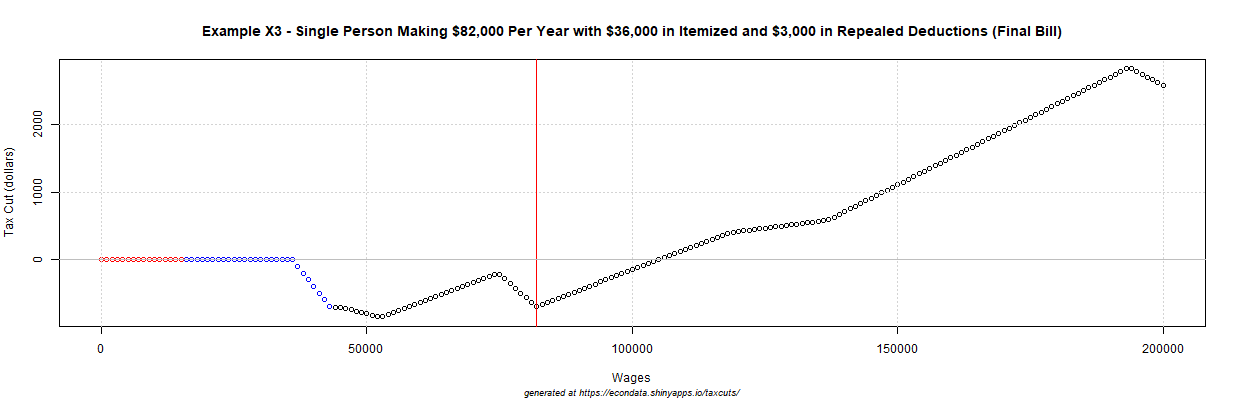
Example X3 - Single Person, $82,000/year, $36,000 Itemized, $3,000 Repealed Deductions

         Names Taxes Released After_Tax
1 Current 2018 5,366             76,634
2   Conference 6,060             75,940
3       Change   693               -693
4     % Change    13                 -1
|
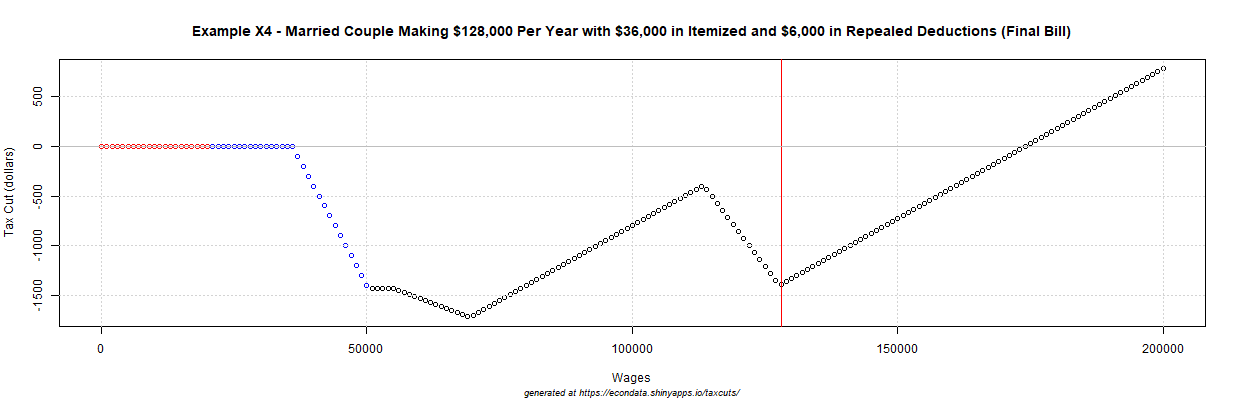
Example X4 - Married Couple, $128,000/year, $36,000 Itemized, $6,000 Repealed Deductions

         Names  Taxes Released After_Tax
1 Current 2018 10,732            117,268
2   Conference 12,119            115,881
3       Change  1,386             -1,386
4     % Change     13                 -1
|
Example X3 - Single Person, $82,000/year, $36,000 Itemized, $3,000 Repealed Deductions

                      Tax Plan     2018 Conference   Change
1  --------------------------- --------   -------- --------
2  Wages, salaries, tips, etc.   82,000     82,000        0
3   Tax-deferred contributions        0          0        0
4                   Exemptions   -4,150          0    4,150
5          Standard deductions        0          0        0
6          Itemized deductions  -39,000    -36,000    3,000
7  --------------------------- --------   -------- --------
8                      Medical        0          0        0
9        State and local taxes        0          0        0
10           Real estate taxes  -13,000    -10,000    3,000
11      Home mortgage interest  -26,000    -26,000        0
12                     Charity        0          0        0
13   Misc. repealed deductions        0          0        0
14 --------------------------- --------   -------- --------
15              Taxable income   38,850     46,000    7,150
16 --------------------------- --------   -------- --------
17       Tax on taxable income    5,366      6,060      693
18                Child credit        0          0        0
19      Other dependent credit        0          0        0
20               Parent credit        0          0        0
21    Earned income tax credit        0          0        0
22 --------------------------- --------   -------- --------
23                  Income tax    5,366      6,060      693
24                 Payroll tax        0          0        0
25 --------------------------- --------   -------- --------
26                   Total tax    5,366      6,060      693
|
Example X4 - Married Couple, $128,000/year, $36,000 Itemized, $6,000 Repealed Deductions

                      Tax Plan     2018 Conference   Change
1  --------------------------- --------   -------- --------
2  Wages, salaries, tips, etc.  128,000    128,000        0
3   Tax-deferred contributions        0          0        0
4                   Exemptions   -8,300          0    8,300
5          Standard deductions        0          0        0
6          Itemized deductions  -42,000    -36,000    6,000
7  --------------------------- --------   -------- --------
8                      Medical        0          0        0
9        State and local taxes        0          0        0
10           Real estate taxes  -16,000    -10,000    6,000
11      Home mortgage interest  -26,000    -26,000        0
12                     Charity        0          0        0
13   Misc. repealed deductions        0          0        0
14 --------------------------- --------   -------- --------
15              Taxable income   77,700     92,000   14,300
16 --------------------------- --------   -------- --------
17       Tax on taxable income   10,732     12,119    1,386
18                Child credit        0          0        0
19      Other dependent credit        0          0        0
20               Parent credit        0          0        0
21    Earned income tax credit        0          0        0
22 --------------------------- --------   -------- --------
23                  Income tax   10,732     12,119    1,386
24                 Payroll tax        0          0        0
25 --------------------------- --------   -------- --------
26                   Total tax   10,732     12,119    1,386
|
|
|
|
|
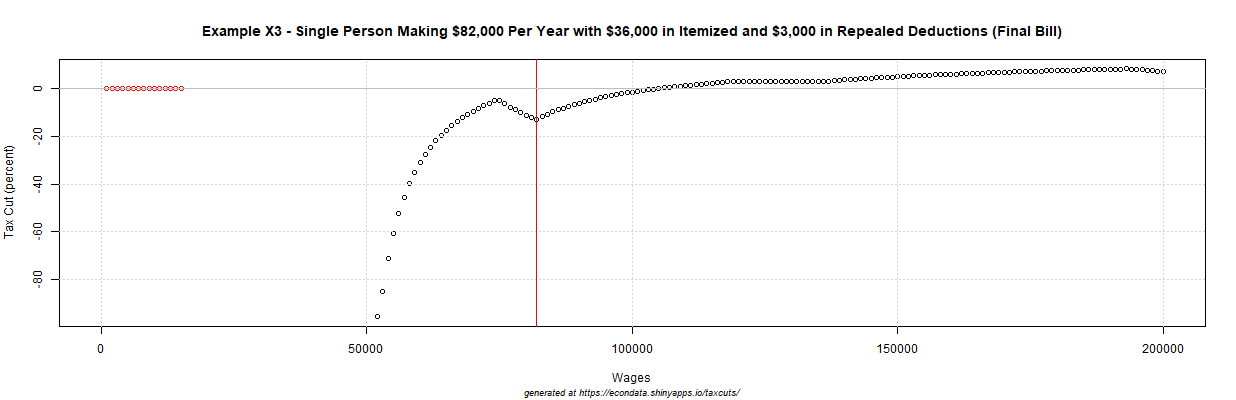
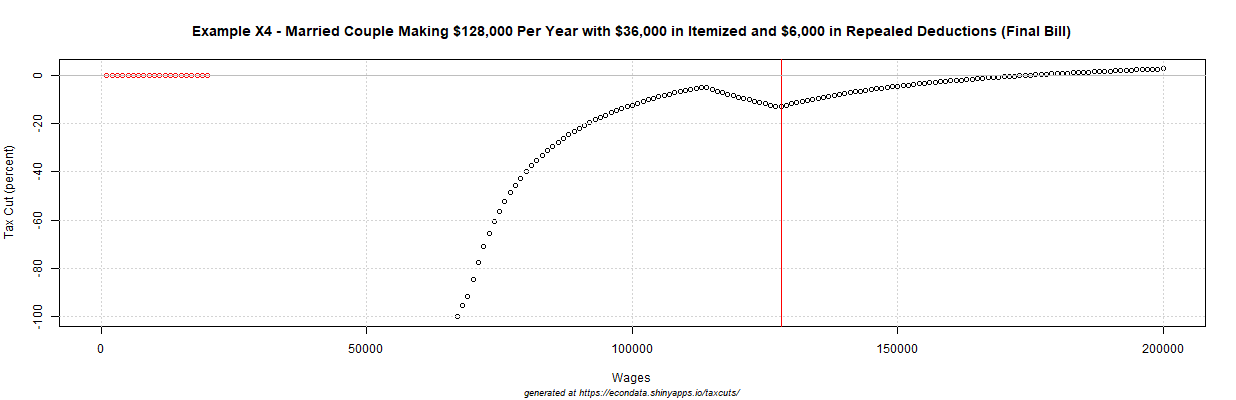
As can be seen from the calculation of the taxes, both of the above examples have repealed deductions due to having property taxes above the $10,000 limit. The two examples assume an effective property tax rate of 1.3 percent and 1.6 percent, respectively. This is line with some of the property tax rates shown on this map from the Tax Foundation. The mortgage interest of $26,000 comes from assuming that it has a 30-year mortgage with 3.4667 percent interest and 25 percent down (1,000,000 * 0.75 * 0.034667). Note that paying 25 percent down keeps the debt under the new $750,000 limit.
As the tables show, both examples result in a 13 percent tax increase. The plots show that for single taxpayers, taxes will increase between incomes of about $37,000 and $105,000 and for married couples, taxes will increase between incomes of about $37,000 and $174,000.
Taxpayers Who Live in States with High Income Tax Rates
The above examples look at homeowners because lower and middle income taxpayers who have large deductions tend to be homeowners. Because they don't include state income taxes, they could generally apply to taxpayers in any state. However, states that do have high income tax rates present an additional problem to some middle income and most all high income taxpayers. The following tables and plots show examples for single taxpayers and married couples with incomes up to 2 million dollars:
Example X5 - Single Person with 8 Percent of Income in State and Local Taxes

         Names   Taxes Released After_Tax
1 Current 2018 124,530            345,470
2   Conference 135,990            334,010
3       Change  11,459            -11,459
4     % Change       9                 -3
|
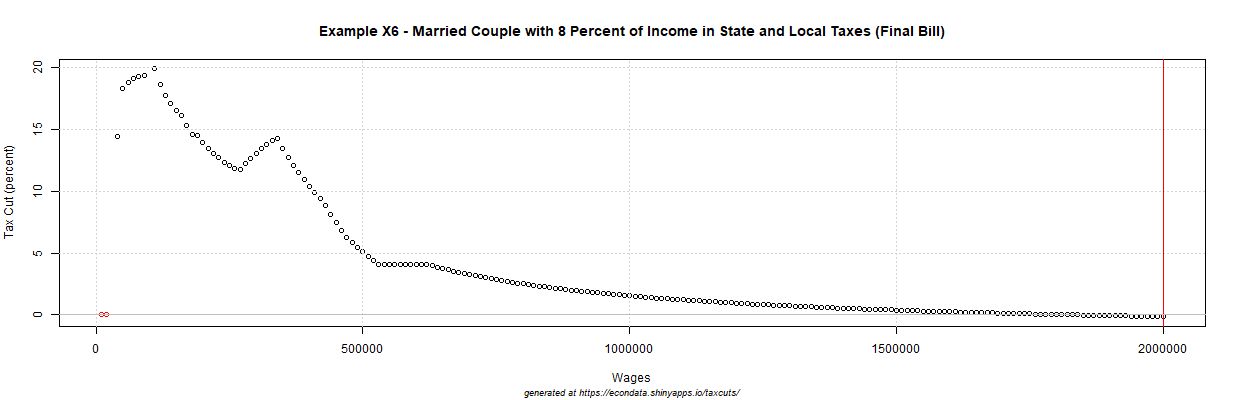
Example X6 - Married Couple with 8 Percent of Income in State and Local Taxes

         Names   Taxes Released After_Tax
1 Current 2018 669,497          1,330,503
2   Conference 670,499          1,329,501
3       Change   1,002             -1,002
4     % Change       0                  0
|
Example X5 - Single Person with 8 Percent of Income in State and Local Taxes

                      Tax Plan     2018 Conference   Change
1  --------------------------- --------   -------- --------
2  Wages, salaries, tips, etc.  470,000    470,000        0
3   Tax-deferred contributions        0          0        0
4                   Exemptions   -4,150          0    4,150
5          Standard deductions        0    -12,000  -12,000
6          Itemized deductions  -37,600          0   37,600
7  --------------------------- --------   -------- --------
8                      Medical        0          0        0
9        State and local taxes  -37,600    -10,000   27,600
10           Real estate taxes        0          0        0
11      Home mortgage interest        0          0        0
12                     Charity        0          0        0
13   Misc. repealed deductions        0          0        0
14 --------------------------- --------   -------- --------
15              Taxable income  428,250    458,000   29,750
16 --------------------------- --------   -------- --------
17       Tax on taxable income  124,530    135,990   11,459
18                Child credit        0          0        0
19      Other dependent credit        0          0        0
20               Parent credit        0          0        0
21    Earned income tax credit        0          0        0
22 --------------------------- --------   -------- --------
23                  Income tax  124,530    135,990   11,459
24                 Payroll tax        0          0        0
25 --------------------------- --------   -------- --------
26                   Total tax  124,530    135,990   11,459
|
Example X6 - Married Couple with 8 Percent of Income in State and Local Taxes

                      Tax Plan      2018 Conference   Change
1  ---------------------------  --------   -------- --------
2  Wages, salaries, tips, etc. 2,000,000  2,000,000        0
3   Tax-deferred contributions         0          0        0
4                   Exemptions    -8,300          0    8,300
5          Standard deductions         0    -24,000  -24,000
6          Itemized deductions  -160,000          0  160,000
7  ---------------------------  --------   -------- --------
8                      Medical         0          0        0
9        State and local taxes  -160,000    -10,000  150,000
10           Real estate taxes         0          0        0
11      Home mortgage interest         0          0        0
12                     Charity         0          0        0
13   Misc. repealed deductions         0          0        0
14 ---------------------------  --------   -------- --------
15              Taxable income 1,831,700  1,976,000  144,300
16 ---------------------------  --------   -------- --------
17       Tax on taxable income   669,497    670,499    1,002
18                Child credit         0          0        0
19      Other dependent credit         0          0        0
20               Parent credit         0          0        0
21    Earned income tax credit         0          0        0
22 ---------------------------  --------   -------- --------
23                  Income tax   669,497    670,499    1,002
24                 Payroll tax         0          0        0
25 ---------------------------  --------   -------- --------
26                   Total tax   669,497    670,499    1,002
|

|
|
|
|
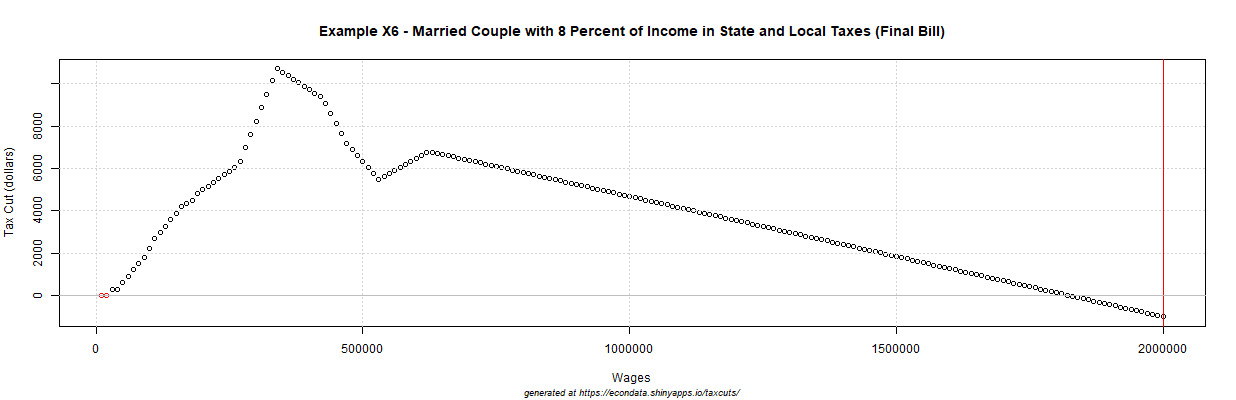
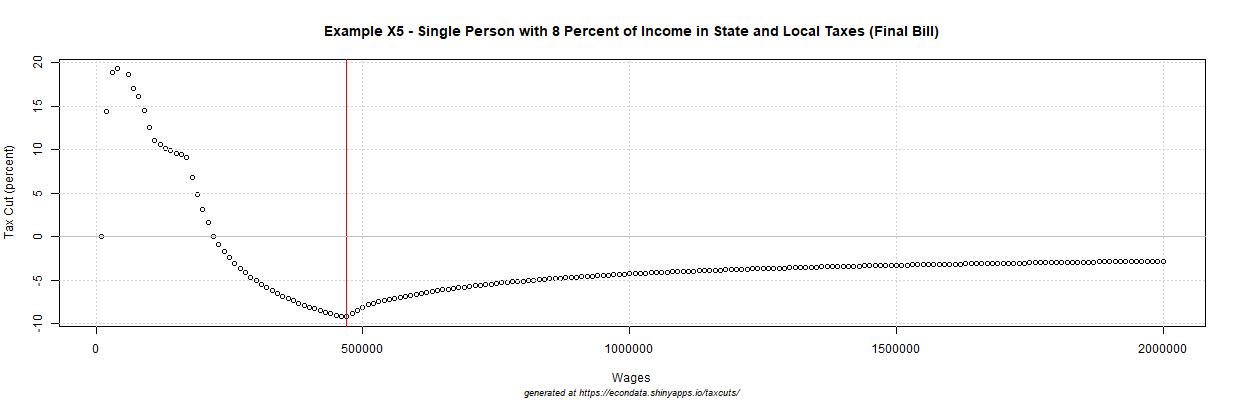
The above examples assume an effective state income tax rate of 8 percent. This is in line with some of the state income tax rates shown on this map from the Tax Foundation. Most of the states with top marginal rates above 8 percent are so-called blue states though there is one (Iowa) that is not. In any case, the plot shows that an 8 percent rate results in a single taxpayer having their taxes increase by about 9 percent at an income of $470,000. The increase then starts to become less, reaching about 3 percent at an income of $2 million. A married couple, however, will continue to receive a tax cut until an income of about $2 million at which their tax will increase by just $1,002. The reason for this difference between the effect of the tax cut on single taxpayers and married couples appears to be due to the change in the brackets. For a single taxpayer, the tax rate actually goes up from 33% to 35% between $200,000 and $424,950. For married couples, there is a similar glitch where the tax rate goes up from 33% to 35% but it only goes from $400,000 to $424,950.
At very high incomes, the effect of an 8 percent state income tax converges to about 1.56 percent for both single taxpayers and married couples. By $200 million, the increases are 1.55% and 1.57%, respectively. The reason for the convergence is that, under the current system, a very high income taxpayer will pay about 39.6 percent on 92 percent of their income (after deducting the 8 percent that they pay to the state). That comes out to 36.432 percent of their income. Under the new system, that taxpayer will just pay about 37 percent on ALL of their income. The increase then is 37 divided by 36.432 or about 1.56 percent. If the effective state income tax is 6 percent, then the change in the tax is 37 - 39.6 * 0.94 which equals -0.224 percent, a slight tax cut. In fact, the break-even state income tax rate is 1 - (37/39.6) which equals about 6.57 percent. This likely has much to do with why the upper tax rate was lowered to 37 percent. This serves to nullify the increase in taxes for taxpayers with very high incomes in states with an top income tax rate of 6.57 percent or less. That's even before considering other changes from which such taxpayers may benefit, such as the lower corporate and pass-through tax rates and cuts in the Alternate Minimum Tax and the estate tax.
The above examples look chiefly at homeowners and other taxpayers whose deductions equal or exceed the amount of the current standard deduction and taxpayers in high tax states. Some taxpayers who are in both groups may see an even larger effect. There are many other concerns such as the currently scheduled expiration of most of the individual tax cuts in 2025 and spending cuts which may be forced by increased deficits. But the above examples highlight some of the taxpayers who will see increases in their taxes immediately.


Comments
Post a Comment