Why does President Trump like a low-interest rate policy?
This blog post lists winners and losers from low interest rates in the United Kingdom. The third item listed under winners is government debt payments and the first chart shows that bond yields are declining but then states the following:
This fall in bond yields is occurring, despite a rise in government debt to GDP, and a persistent budget deficit. It is important for limiting the percentage of tax revenue spent on debt interest payments.
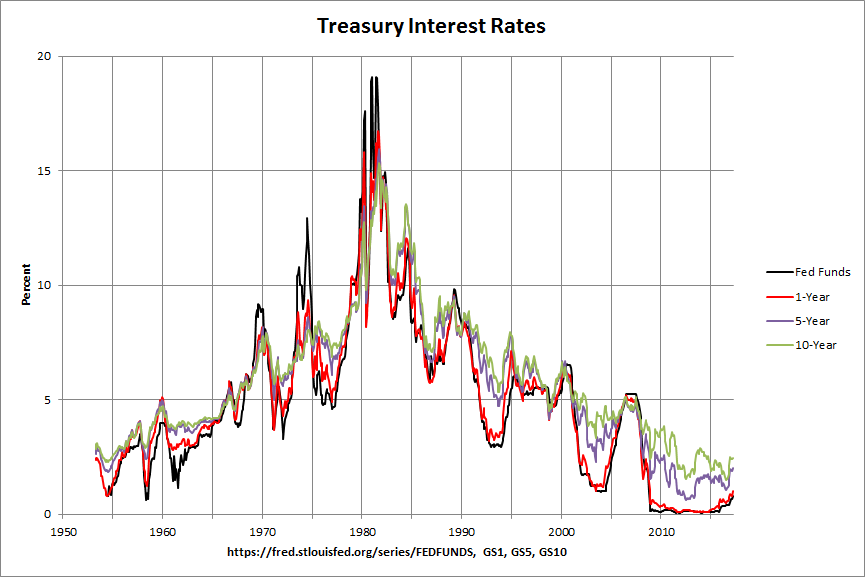
This same statement could be made about the United States. The following chart shows various treasury interest rates since the early 50s:
Note: In the following charts, click on the chart to see its data and sources.
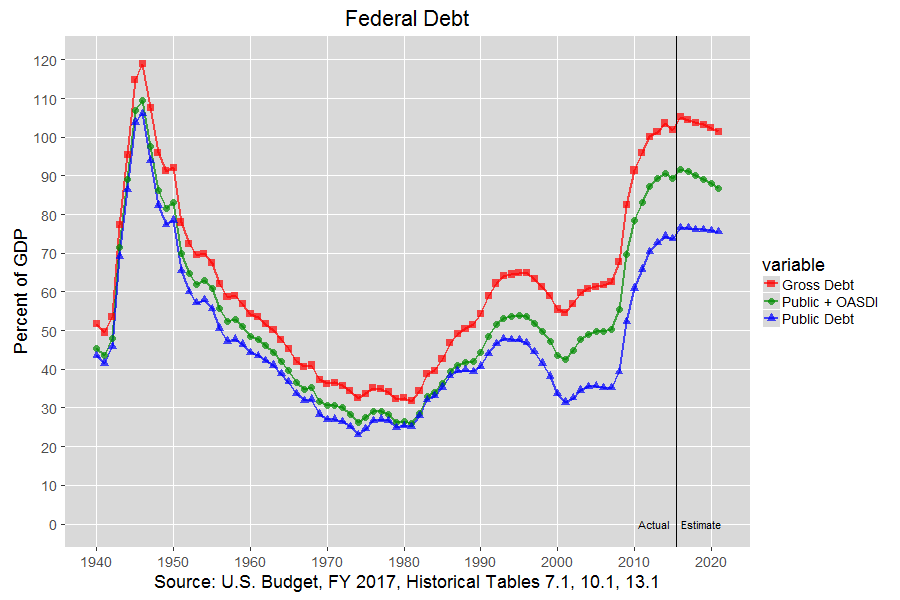
As can be seen, they have been dropping since they reached highs in the early eighties. The following chart then shows the federal debt as a percentage of GDP:
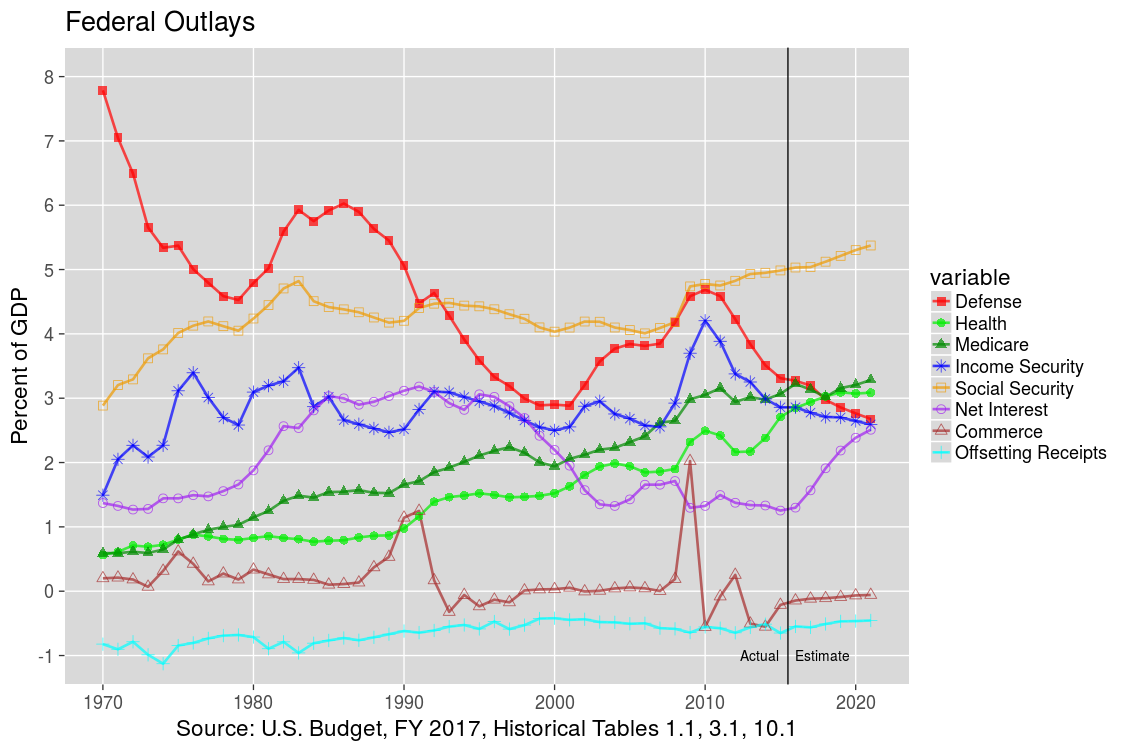
The red line is the gross federal debt and includes the debt owed to Social Security and other government trust funds and the blue line is the federal debt owed to the public. The net interest that is paid on this debt to the public is the purple line in the following chart:
As can be seen, the net interest has come down to historically low levels even as the federal debt has risen sharply. This is due to the historically low interest rates being paid on that debt. However, note that the net interest is projected to double from about 1.25 percent of GDP in 2015 to about 2.5 percent of GDP by 2021. This is chiefly because the interest rates being paid on that debt is projected to increase. The following table shows the projected rates that will be paid on 91-day Treasury bills and 10-year Treasury notes through 2026:
Table S–12. Economic Assumptions
(Calendar years)
                            Actual  Projections
                            ------  -----------------------------------------------------------
                              2014  2015 2016 2017 2018 2019 2020 2021 2022 2023 2024 2025 2026
Interest rates, percent:      ----  ---- ---- ---- ---- ---- ---- ---- ---- ---- ---- ---- ----
  91-day Treasury bills  .....   *     *  0.7  1.8  2.6  3.1  3.3  3.4  3.4  3.3  3.3  3.2  3.2
  10-year Treasury notes ..... 2.5   2.1  2.9  3.5  3.9  4.1  4.2  4.2  4.2  4.2  4.2  4.2  4.2

* 0.05 percent or less.
Source: U.S. Budget, FY 2017, Summary Table S-12
The CBO (Congressional Budget Office) just put out The 2017 Long-Term Budget Outlook in March. On page 19, it states:
The government’s net interest costs are projected to nearly double as a share of the economy over the next decade—from 1.4 percent of GDP in 2017 to 2.7 percent by 2027—as currently low interest rates rise and as greater federal borrowing leads directly to greater debtservice costs. In the extended baseline, those costs reach 6.2 percent of GDP by 2047 (see Figure 5 on page 12).
It would seem very possible that President Trump has been made aware that lower interest rates would have a beneficial effect on the budget, making any planned tax cuts or infrastructure spending more affordable. That could have much to do with why he now likes a low-interest rate policy.


Comments
Post a Comment