Wages, Productivity and Corporate Profits
In the third quarter, corporate earnings were $1.75 trillion, up 18.6% from a year ago, according to last week's gross domestic product report. That took after-tax profits to their greatest percentage of GDP in history.
But the record profits come at the same time that workers' wages have fallen to their lowest-ever share of GDP.
"That's how it works," said Robert Brusca, economist with FAO Research in New York, who said there is a natural tension between profits and the cost of labor. "If one gets bigger, the other gets smaller."
Many of the stories also included a graph which looked like the following:
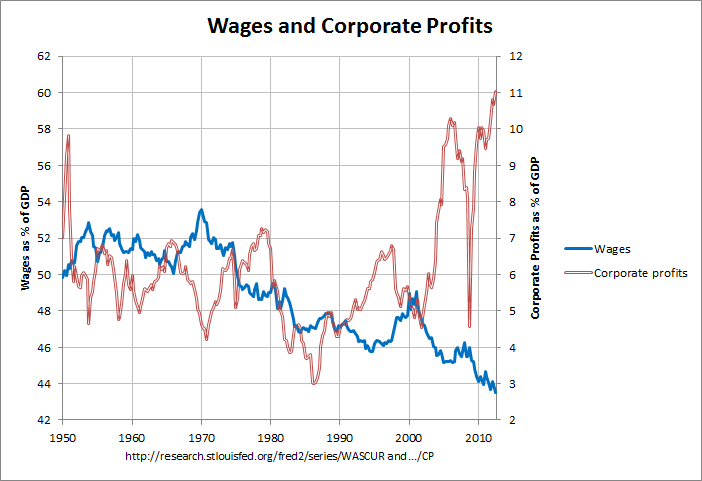
The actual numbers and sources for this and the following graph can be found at this link. As can be seen, corporate profits are at their highest percentage of GDP since 1947 when this series began. Likewise wages and salary accruals are at their lowest percentage of GDP.
On a related topic, some other stories have pointed out a gap between the growth in productivity and real hourly compensation. For example, an August 10th Washington Post Wonkblog post stated the following:
The other part of Romney’s claim — that wages and employment track productivity — is actually false. Unpublished data from BLS, generously provided to me by the Economic Policy Institute’s Larry Mishel and Nicholas Finio, shows that wages tracked productivity growth until about 1970. After that, wages stagnated even as productivity continued to grow.
In fact the BLS (Bureau of Labor Statistics) has published data that shows this phenomena. This data was used to create the following graph:
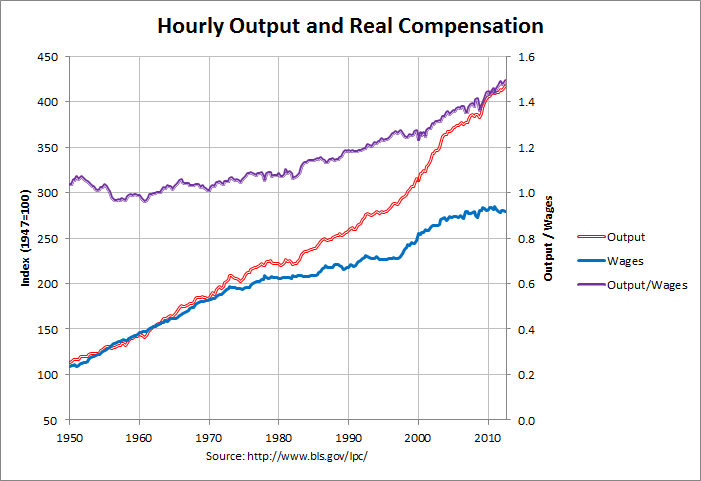
The red line is labor productivity (output per hour) and the blue line is real hourly compensation, both for nonfarm business. The indices were obtained from the BLS web site as described at the bottom of this page and adjusted so that the base year (with a value of 100) was 1947 instead of 2005. As can be seen, real compensation closely tracked productivity until the early 1970s. Compensation did stagnate somewhat until the late nineties and, after about a decade of increased growth, has stagnated again. Productivity, however, stagnated only briefly in the mid seventies and early eighties and has grown briskly since then. This has caused an increasing gap between compensation and productivity.
This increasing gap is shown by the purple line which is the ratio of productivity to compensation. As can be seen, this ratio was fairly stable from 1950 to 1970, grew slowly until about 1982, and has grown fairly briskly since then.
In addition, this gap is addressed in a January 2011 essay in the Monthly Labor Review titled The compensation-productivity gap: a visual essay. That essay looks at the gap during several periods that contain multiple business cycles. The following table shows the annualized change in productivity, compensation, and their ratio for these periods using the data in the prior graph. It also shows the average annual values wages and corporate profits for these periods using the data in the first graph.
              Annual Average       Annualized Change (percent)
           --------------------  -------------------------------
                                                 Real    Produc-
             Wages &  Corporate      Labor     Hourly   tivity /
              Salary    Profits    Produc-    Compen-    Compen-
    Years*  Accruals  After Tax     tivity     sation     sation
---------  ---------  ---------  ---------  ---------  ---------
1947-1973      51.42       6.18       2.73       2.53       0.20
1973-1979      49.66       6.50       1.26       0.91       0.35
1979-1990      47.74       4.47       1.42       0.55       0.86
1990-2000      46.83       5.64       2.27       1.58       0.68
2000-2012      45.62       8.15       2.18       0.75       1.42
As can be seen, productivity did ease up a bit in the seventies and eighties but remained above 1 percent per year even during these periods. Compensation, however, was below 1 percent per year during the 70's and 80's and since 2000. This has caused the compensation-productivity gap to widen fairly quickly since 1979.
The aforementioned essay goes into more detail on some of the causes of this widening gap. Following is an excerpt from that essay:
There are two components that account for the gap between real hourly compensation growth and productivity growth. The first is the difference between the price indexes used to account for inflation in the BLS productivity and hourly compensation measures. The second is the change in “labor share,” which, as explained earlier, is the share of output that is accounted for by workers’ wages, salaries, and benefits.
Before 2000, the difference between the growth rates of the CPI and the IPD—that is, the difference in inflation rates—explained most of the gap in each period. For 2000 to 2009, an unprecedented decline in labor share accounted for most of the gap.
The underlying causes and significance of these two factors are debatable and require further study. What is clear, however, is that wages have been under pressure since the 1970's and this pressure is not explained by a lack of productivity or corporate profits.
Note: There is a discussion of this post at this link.


Comments
Post a Comment