The Long-Run Budget Outlook (2012 Budget)
The U.S. Budget for fiscal year 2012 was released on February 14, 2011. As in prior years, it included the Analytical Perspectives which contains a section on the long-run budget outlook. The following graph shows the outlook for federal receipts, outlays, and debt held by the public as projected by this section.
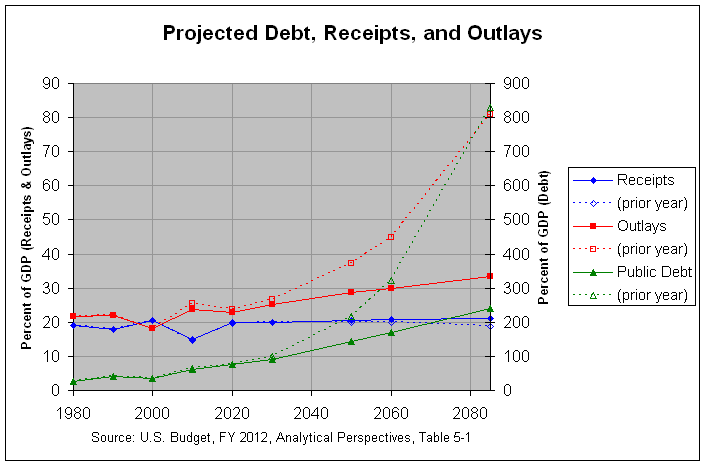
The actual numbers and sources for this and the following graph can be found at this link. As can be seen, receipts are projected to rise and spending is projected to drop over the next 10 years, causing the deficit to narrow to 3.1 percent of GDP by 2020. However, outlays are then projected to begin a steady rise, causing the deficit to reach 12.3 percent of GDP by 2085. This is projected to cause the debt held by the public to rise to 239.9 percent of GDP. This is more than double the prior high of 108.7 percent of GDP reached in 1946, at the end of World War II.
Still, this is a major improvement over the projections from the prior budget. The dashed lines in the above graph show the receipts, outlays, and debt held by the public as projected in the prior budget. As can be seen from the third table at this link, the debt held by the public had been projected to rise to 829.7 percent of GDP, over seven times the prior high reached in 1946. What was the cause of this major improvement from the prior budget? On this topic, the first and third tables at the above link show the projected receipts and outlays from the 2012 and 2011 budgets. Following is a copy of the fifth table which shows the change in the projected receipts and outlays from the 2011 to the 2012 budget:
As can be seen, there is an improvement of 50% of GDP in the projected deficit in 2085 (from 62% to 12% of GDP). Of this 50% of GDP, nearly all (47.5% of GDP) is from lower projected outlays. Of this 47.5% of GDP, 27.1% is from lower Net Interest, 19.8 is from lower Mandatory Spending, and a mere 0.6% is from lower Discretionary Spending. Finally, of the 19.8% of GDP from lower Mandatory Spending, a majority of 16.7% of GDP is from lower Medicare spending and a much lower 3.3% of GDP is from lower Medicaid spending. The lower Medicare and Medicaid spending is largely due to passage of the Affordable Care Act (ACA). This is described in the following excerpt from pages 50 and 51 of the Analytical Perspectives:
Medicare and Medicaid.— In the long-run projections in this chapter, different assumptions about the growth rate of health care costs are made. In the base case, a continuation of current policy assumes that the provisions of the ACA are fully implemented, limiting health care costs in the long run compared with prior law. The long-run Medicare assumptions are essentially the same as those used in the latest Medicare Trustees’ report (August 2010), which is consistent with how these long-term budget projections have generally been made in the past. The Trustees’ projections imply that average long range annual growth in Medicare spending per enrollee is 0.3 percentage points per year above the growth in GDP per capita. This growth rate is significantly smaller than their previous projections—a reduction they largely attribute to the ACA.
This section goes on to describe the relevant reforms in the ACA:
Along with the rules for Medicare, there are a number of reforms in the ACA that experts believe could produce significant savings relative to the historical trend and that would affect medical costs more broadly. One is an excise tax on the highest-cost insurance plans, which will encourage substitution of plans with lower costs, while raising take-home pay. There is also an array of delivery system reforms, including incentives for accountable care organizations and payment reform demonstrations that have the potential to re-orient the medical system toward providing higher quality care, not just more care, and thus reduce cost growth in the future. Finally, the ACA established an independent payment advisory board that will be empowered to propose changes in Medicare should Medicare costs exceed the growth rate specified in law. The proposed changes in Medicare would take effect automatically, unless overridden by the Congress. Because of these broader reforms, Medicaid spending per beneficiary and private health spending per capita are also projected to slow, though not as much as Medicare.
The following graph shows the growth in outlays that are projected, given the ACA reforms and all other assumptions of the 2012 budget:
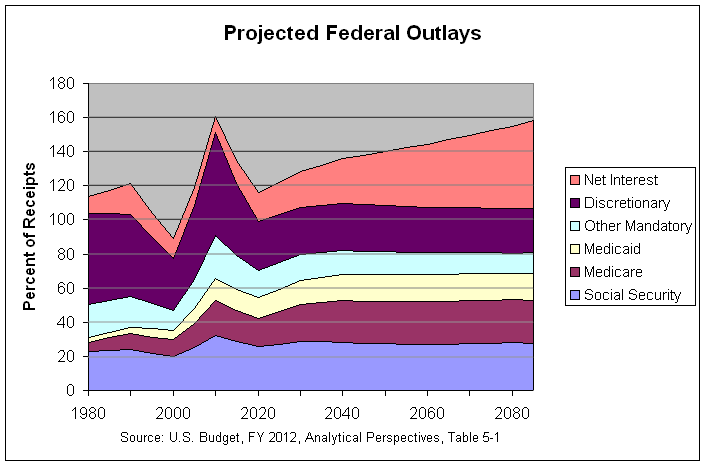
As can be seen, Medicare and Medicaid costs do grow somewhat until about 2040 but seem to pretty well stabilize (as a percentage of GDP) from then until 2085. This is a large improvement from the second graph at this link which shows the prior year's projections that Medicare and Medicaid costs would grow rapidly until 2085. This shows the importance of insuring that the reforms of the ACA (or similar reforms) take place and have their projected effect. However, the above graph also shows that, even though non-interest spending is projected to stabilize at just above total projected revenues, Net Interest is projected to keep growing, pushing the deficit ever higher. This is because, as can be seen in the first graph above, the debt on which that interest is paid is projected to keep growing. This shows that non-interest spending needs to be stabilized at a lower level and/or receipts need to rise. Regarding this, page 50 of the Analytical Perspectives states the following:
Without further adjustments to spending and revenue, the deficit will rise relative to the overall economy and the debt-to-GDP ratio will far exceed its previous peak level reached at the end of World War II. Reforms are needed to avoid such a development. The Administration aims to work with the Congress so that the ratio of debt to GDP stabilizes at an acceptable level once the economy has recovered.
Note: There is a discussion of this post at this link.
The actual numbers and sources for this and the following graph can be found at this link. As can be seen, receipts are projected to rise and spending is projected to drop over the next 10 years, causing the deficit to narrow to 3.1 percent of GDP by 2020. However, outlays are then projected to begin a steady rise, causing the deficit to reach 12.3 percent of GDP by 2085. This is projected to cause the debt held by the public to rise to 239.9 percent of GDP. This is more than double the prior high of 108.7 percent of GDP reached in 1946, at the end of World War II.
Still, this is a major improvement over the projections from the prior budget. The dashed lines in the above graph show the receipts, outlays, and debt held by the public as projected in the prior budget. As can be seen from the third table at this link, the debt held by the public had been projected to rise to 829.7 percent of GDP, over seven times the prior high reached in 1946. What was the cause of this major improvement from the prior budget? On this topic, the first and third tables at the above link show the projected receipts and outlays from the 2012 and 2011 budgets. Following is a copy of the fifth table which shows the change in the projected receipts and outlays from the 2011 to the 2012 budget:
     CHANGE IN LONG-RUN BUDGET PROJECTIONS FROM THE 2011 TO THE 2012 BUDGET: 1980-2085
                                      (percent of GDP)
                    ------------------------------------------------------------------------
                        1980    1990    2000    2010    2020    2030    2050    2060    2085
                    ------------------------------------------------------------------------
Receipts...........      0.0     0.0     0.0     0.1     0.3     0.0     0.5     0.8     2.5
Outlays............      0.0     0.0     0.0    -1.6    -0.7    -1.5    -8.5   -15.0   -47.5
  Discretionary....      0.0     0.0     0.0    -0.6    -0.5    -0.6    -0.6    -0.6    -0.6
  Mandatory........      0.0     0.0     0.0    -1.0    -0.2    -0.3    -4.4    -7.3   -19.8
    Social Security      0.0     0.0     0.0    -0.1     0.1     0.1     0.2     0.3     0.8
    Medicare.......      0.0     0.0     0.0     0.0    -0.7    -1.0    -4.5    -6.7   -16.7
    Medicaid.......      0.0     0.0     0.0     0.0     0.4     0.4    -0.2    -0.8    -3.3
    Other..........      0.0     0.0     0.0    -1.0     0.1     0.2     0.1     0.0    -0.5
  Net Interest.....      0.0     0.0     0.0     0.1    -0.1    -0.4    -3.5    -7.1   -27.1
Surplus/Deficit (-)      0.0     0.0     0.0     1.7     1.1     1.4     8.9    15.8    50.0
Primary Surplus/Def      0.0     0.0     0.0     1.8     0.9     0.9     5.5     8.8    22.9
Debt Held by Public      0.0     0.0     0.0    -1.4    -0.5    -8.4   -73.8  -153.7  -589.8
As can be seen, there is an improvement of 50% of GDP in the projected deficit in 2085 (from 62% to 12% of GDP). Of this 50% of GDP, nearly all (47.5% of GDP) is from lower projected outlays. Of this 47.5% of GDP, 27.1% is from lower Net Interest, 19.8 is from lower Mandatory Spending, and a mere 0.6% is from lower Discretionary Spending. Finally, of the 19.8% of GDP from lower Mandatory Spending, a majority of 16.7% of GDP is from lower Medicare spending and a much lower 3.3% of GDP is from lower Medicaid spending. The lower Medicare and Medicaid spending is largely due to passage of the Affordable Care Act (ACA). This is described in the following excerpt from pages 50 and 51 of the Analytical Perspectives:
Medicare and Medicaid.— In the long-run projections in this chapter, different assumptions about the growth rate of health care costs are made. In the base case, a continuation of current policy assumes that the provisions of the ACA are fully implemented, limiting health care costs in the long run compared with prior law. The long-run Medicare assumptions are essentially the same as those used in the latest Medicare Trustees’ report (August 2010), which is consistent with how these long-term budget projections have generally been made in the past. The Trustees’ projections imply that average long range annual growth in Medicare spending per enrollee is 0.3 percentage points per year above the growth in GDP per capita. This growth rate is significantly smaller than their previous projections—a reduction they largely attribute to the ACA.
This section goes on to describe the relevant reforms in the ACA:
Along with the rules for Medicare, there are a number of reforms in the ACA that experts believe could produce significant savings relative to the historical trend and that would affect medical costs more broadly. One is an excise tax on the highest-cost insurance plans, which will encourage substitution of plans with lower costs, while raising take-home pay. There is also an array of delivery system reforms, including incentives for accountable care organizations and payment reform demonstrations that have the potential to re-orient the medical system toward providing higher quality care, not just more care, and thus reduce cost growth in the future. Finally, the ACA established an independent payment advisory board that will be empowered to propose changes in Medicare should Medicare costs exceed the growth rate specified in law. The proposed changes in Medicare would take effect automatically, unless overridden by the Congress. Because of these broader reforms, Medicaid spending per beneficiary and private health spending per capita are also projected to slow, though not as much as Medicare.
The following graph shows the growth in outlays that are projected, given the ACA reforms and all other assumptions of the 2012 budget:
As can be seen, Medicare and Medicaid costs do grow somewhat until about 2040 but seem to pretty well stabilize (as a percentage of GDP) from then until 2085. This is a large improvement from the second graph at this link which shows the prior year's projections that Medicare and Medicaid costs would grow rapidly until 2085. This shows the importance of insuring that the reforms of the ACA (or similar reforms) take place and have their projected effect. However, the above graph also shows that, even though non-interest spending is projected to stabilize at just above total projected revenues, Net Interest is projected to keep growing, pushing the deficit ever higher. This is because, as can be seen in the first graph above, the debt on which that interest is paid is projected to keep growing. This shows that non-interest spending needs to be stabilized at a lower level and/or receipts need to rise. Regarding this, page 50 of the Analytical Perspectives states the following:
Without further adjustments to spending and revenue, the deficit will rise relative to the overall economy and the debt-to-GDP ratio will far exceed its previous peak level reached at the end of World War II. Reforms are needed to avoid such a development. The Administration aims to work with the Congress so that the ratio of debt to GDP stabilizes at an acceptable level once the economy has recovered.
Note: There is a discussion of this post at this link.


I caught your blog over at Logarchism.
ReplyDeleteA question if I may: Why do you credit any of the assumptions in the Administration's budget given they have never been remotely accurate in the past?
The Medicare and Medicaid assumptions alone are ludicrous.
The Medicaid actuaries are warning that Obamacare will push a minimum of 20 million new recipients onto what is supposed to be a program for the poor. Far more from the middle class are now eligible if their employers decide to save thousands per employee by paying the Obamacare fine, terminating employee health insurance and pushing their employees onto Medicaid. Under the very similar Romneycare, MA taxpayers suffered a surge in new Medicaid dependents and the state's budget deficit is roughly equal to this new entitlement cost.
The Medicare figures are based upon the new Independent Payment panel slashing $500 billion in Medicare benefits and/or compensation to doctors. None of these alleged savings go to reducing spending because this and far more revenues are tapped to finance Obamacare.
A question if I may: Why do you credit any of the assumptions in the Administration's budget given they have never been remotely accurate in the past?
ReplyDeleteAs I said in comment #18 there, my goal was to present the long-run projections and give the budget's explanation for the improvement over last year's budget. Carefully laying out who is claiming what is admittedly just the first step for any debate on the subject. However, it is an important step and one that I all too often see skipped in political debate.
The Medicare and Medicaid assumptions alone are ludicrous.
Feel free to provide links to any analyses that back this contention. The budget contends that their Medicare projections are drawn from those of the Medicare trustees. This, of course, does not mean that they are accurate. However, you need to provide some counter-evidence, preferable a link to a credible analysis.
The Medicaid actuaries are warning that Obamacare will push a minimum of 20 million new recipients onto what is supposed to be a program for the poor.
Yes, I ran across that story at this link. This is one reason that I generally favor shorter and simpler bills where such oversights are less likely to occur. However, long complicated bills seem to be in favor on both sides of the aisle.
The Medicare figures are based upon the new Independent Payment panel slashing $500 billion in Medicare benefits and/or compensation to doctors. None of these alleged savings go to reducing spending because this and far more revenues are tapped to finance Obamacare.
I am not an expert on this bill and do not know the chance of success of its various provisions. I believe that the CBO scored the bill but I haven't looked at that analysis. Hence, feel free to post a link to any credible analysis that supports your statements.