CBO Cost Estimate of the Tax Deal
On December 10th, the Congressional Budget Office released a one-page table which shows the estimated cost for the so-called "tax deal". More specifically, it shows the estimated change in revenues and direct spending for S.A. 4753, an amendment to H.R. 4853, the Tax Relief, Unemployment Insurance Reauthorization, and Job Creation Act of 2010. The following graph shows the resulting revenues, outlays, and deficits when this change is added to the current baseline:
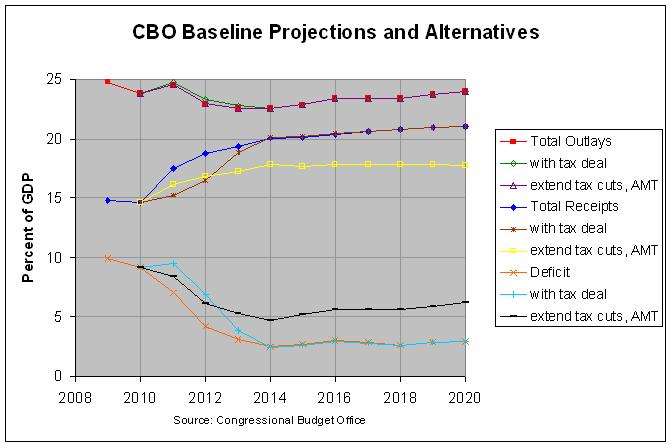
The graph also shows the revenues, outlays, and deficits for the baseline and the alternative under which EGTRRA and JGTRRA (the 2001 and 2003 Bush tax cuts) are permanently extended and AMT (Alternative Minimum Tax) is indexed for inflation. The actual numbers and sources for this and the following graph can be found at this link.
As can be seen, none of the alternatives have much effect on outlays. Regarding revenues, the tax deal causes a two-year slowdown in their projected recovery and the permanent extension and AMT fix causes a continuing slowdown with revenues remaining between 17 and 18 percent of GDP through 2020. As a result, a reverse relationship occurs with the deficit. The tax deal causes a two-year slowdown in the improvement of the deficit and the permanent extension and AMT fix causes a continuing slowdown with the deficit actually rising from 4.7% of GDP in 2014 to 6.2% of GDP in 2020.
The following graph shows the resulting gross federal debt and debt held by the public for the baseline, tax deal, and permanent extension and AMT fix:
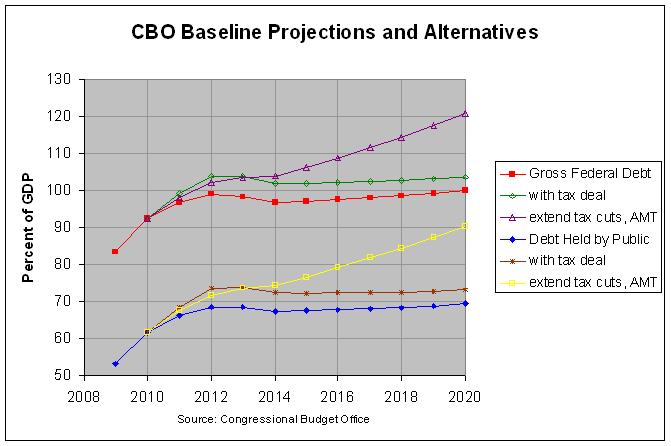
The gross federal debt equals the debt held by the public plus the monies owed to the trust funds, chiefly Social Security. As can be seen, the tax deal causes an increase in both debts but one that does not grow over time. In fact the increase appears to lessen slightly, reaching 3.7% of GDP for both debts in 2020. On the contrary, the permanent extension and AMT fix causes both debts to continue a steady growth through 2020. The debt held by the public and the gross federal debt would be projected to climb to 90.3% and 120.8 percent of GDP by 2020, respectively. The 120.8% of GDP figure would be just short of the 121.7% of GDP peak that it reached at the end of World War II.
The above graphs suggest that a key concern is that the current tax deal not become a permanent extension. Unfortunately, the current situation shows how difficult it is to allow a long-term tax cut to expire, especially in a difficult economic environment. This would suggest that temporary long-term tax cuts are a very bad policy. If projections suggest that a long-term tax cut is not sustainable, the tax cut should be scaled back to a level where it is sustainable and to where no built-in expiration is required.
The graph also shows the revenues, outlays, and deficits for the baseline and the alternative under which EGTRRA and JGTRRA (the 2001 and 2003 Bush tax cuts) are permanently extended and AMT (Alternative Minimum Tax) is indexed for inflation. The actual numbers and sources for this and the following graph can be found at this link.
As can be seen, none of the alternatives have much effect on outlays. Regarding revenues, the tax deal causes a two-year slowdown in their projected recovery and the permanent extension and AMT fix causes a continuing slowdown with revenues remaining between 17 and 18 percent of GDP through 2020. As a result, a reverse relationship occurs with the deficit. The tax deal causes a two-year slowdown in the improvement of the deficit and the permanent extension and AMT fix causes a continuing slowdown with the deficit actually rising from 4.7% of GDP in 2014 to 6.2% of GDP in 2020.
The following graph shows the resulting gross federal debt and debt held by the public for the baseline, tax deal, and permanent extension and AMT fix:
The gross federal debt equals the debt held by the public plus the monies owed to the trust funds, chiefly Social Security. As can be seen, the tax deal causes an increase in both debts but one that does not grow over time. In fact the increase appears to lessen slightly, reaching 3.7% of GDP for both debts in 2020. On the contrary, the permanent extension and AMT fix causes both debts to continue a steady growth through 2020. The debt held by the public and the gross federal debt would be projected to climb to 90.3% and 120.8 percent of GDP by 2020, respectively. The 120.8% of GDP figure would be just short of the 121.7% of GDP peak that it reached at the end of World War II.
The above graphs suggest that a key concern is that the current tax deal not become a permanent extension. Unfortunately, the current situation shows how difficult it is to allow a long-term tax cut to expire, especially in a difficult economic environment. This would suggest that temporary long-term tax cuts are a very bad policy. If projections suggest that a long-term tax cut is not sustainable, the tax cut should be scaled back to a level where it is sustainable and to where no built-in expiration is required.


Comments
Post a Comment