Long-term Unemployment (updated)
On July 2nd, the Bureau of Labor Statistics released its Employment Situation Summary for June of 2010. Following is the first paragraph:
Total nonfarm payroll employment declined by 125,000 in June, and the unemployment rate edged down to 9.5 percent, the U.S. Bureau of Labor Statistics reported today. The decline in payroll employment reflected a decrease (-225,000) in the number of temporary employees working on Census 2010. Private-sector payroll employment edged up by 83,000.
The drop of 125,000 in nonfarm payroll employment put the number of nonfarm payroll jobs at 130.47 million, just about the same level that existed in December of 1999. Hence, we have gone 10 and a half years with no job growth.
Perhaps more disturbing, however, has been the growth in long-term unemployment. On this topic, the December report stated the following:
In June, the number of long-term unemployed (those jobless for 27 weeks and over) was unchanged at 6.8 million. These individuals made up 45.5 percent of unemployed persons. (See table A-12.)
The following graph shows the average and median duration of unemployment since 1948:
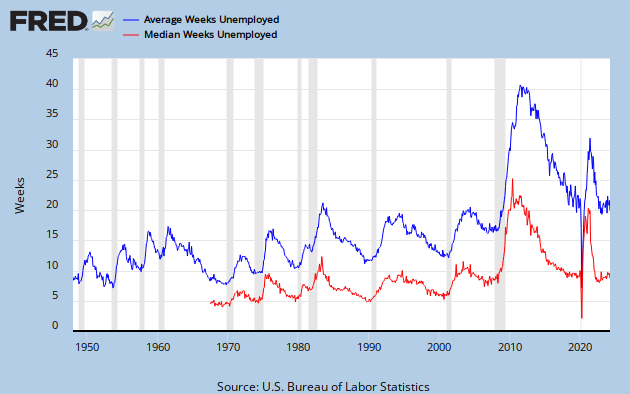
Links to the actual data used to create this graph can be found at this link. As can be seen, the average and median duration of unemployment have risen to what is by far their highest level since 1948 and 1967, respectively. The average has reached 35.2 weeks and the median has reached 25.5 weeks weeks.
The following graph shows unemployment divided up into four durations:
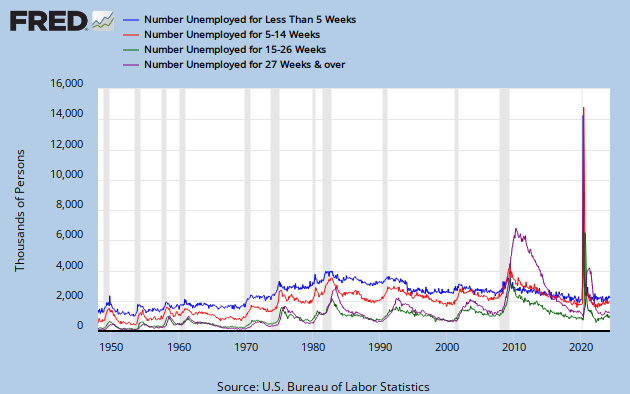
As before, links to the actual data used to create this graph can be found at this link. As can be seen, the number of workers unemployed for 27 weeks and over reached 6.8 million in June. This is over double the prior high of 2.9 million reached in June of 1983. The number of workers unemployed for 15 to 26 weeks was 2.2 million in June, down from the recent high of 3.2 million reached in October of 2009. The number of workers unemployed for 5 to 14 weeks was 3.1 million in June, down from the recent high of 4.3 reached in May of 2009. Finally, the number of worker unemployed for less than 5 weeks was 2.8 million in December, down from the recent high of 3.6 million reached in January of 2009. Hence, all of the durations are starting to trend down except for the longest, those unemployed for 27 weeks and over.
It should be noted that neither of the above graphs include the Great Depression. However, they do show that long-term unemployment has by far reached its highest level since the end of World War II. This would suggest that long-term unemployment may require special attention in the effort to put the unemployed back to work.
Total nonfarm payroll employment declined by 125,000 in June, and the unemployment rate edged down to 9.5 percent, the U.S. Bureau of Labor Statistics reported today. The decline in payroll employment reflected a decrease (-225,000) in the number of temporary employees working on Census 2010. Private-sector payroll employment edged up by 83,000.
The drop of 125,000 in nonfarm payroll employment put the number of nonfarm payroll jobs at 130.47 million, just about the same level that existed in December of 1999. Hence, we have gone 10 and a half years with no job growth.
Perhaps more disturbing, however, has been the growth in long-term unemployment. On this topic, the December report stated the following:
In June, the number of long-term unemployed (those jobless for 27 weeks and over) was unchanged at 6.8 million. These individuals made up 45.5 percent of unemployed persons. (See table A-12.)
The following graph shows the average and median duration of unemployment since 1948:
Links to the actual data used to create this graph can be found at this link. As can be seen, the average and median duration of unemployment have risen to what is by far their highest level since 1948 and 1967, respectively. The average has reached 35.2 weeks and the median has reached 25.5 weeks weeks.
The following graph shows unemployment divided up into four durations:
As before, links to the actual data used to create this graph can be found at this link. As can be seen, the number of workers unemployed for 27 weeks and over reached 6.8 million in June. This is over double the prior high of 2.9 million reached in June of 1983. The number of workers unemployed for 15 to 26 weeks was 2.2 million in June, down from the recent high of 3.2 million reached in October of 2009. The number of workers unemployed for 5 to 14 weeks was 3.1 million in June, down from the recent high of 4.3 reached in May of 2009. Finally, the number of worker unemployed for less than 5 weeks was 2.8 million in December, down from the recent high of 3.6 million reached in January of 2009. Hence, all of the durations are starting to trend down except for the longest, those unemployed for 27 weeks and over.
It should be noted that neither of the above graphs include the Great Depression. However, they do show that long-term unemployment has by far reached its highest level since the end of World War II. This would suggest that long-term unemployment may require special attention in the effort to put the unemployed back to work.


Comments
Post a Comment