The Long-Run Budget Outlook (2011 Budget)
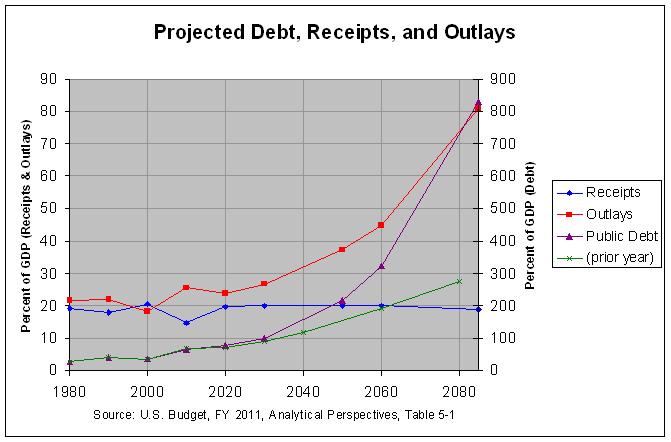
As mentioned in my prior post, the U.S. Budget for fiscal year 2011 was released on February 1, 2010. As in prior years, it included the Analytical Perspectives which contains a section on the long-run budget outlook. The following graph shows the outlook for the federal receipts, outlays, and debt held by the public as projected by this section.

The actual numbers and sources for this and the following graph can be found at this link. As can be seen, receipts are projected to rise and spending is projected to drop over the next 10 years, causing the deficit to narrow to 4.2 percent of GDP by 2020. However, outlays are then projected to begin a steady rise, causing the deficit to reach a record 62.3 percent of GDP by 2085. This is projected to cause the debt held by the public to rise to 829.7 percent of GDP. This is over seven times the prior high of 108.7 percent of GDP reached in 1946, at the end of World War II. In addition, it is over double the level projected in the prior budget. The projections for this year and last year are the purple and green lines in the above graph.
Regarding the projected increase in the deficit and debt, Chapter 5 of the Analytical Perspectives says the following:
The key drivers of the long-range deficit are the Government’s major health and retirement programs: Medicare, Medicaid and Social Security.
Further on, it narrows this a bit, stating:
The most important single factor driving the long-run budget outlook is the growth of health care expenditures.
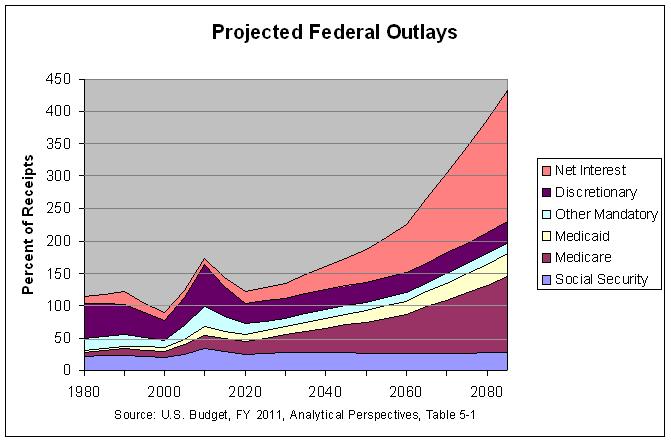
This growth in health care expenditures can be seen in the following graph which shows the projected growth in outlays according to the 2011 budget.

As can be seen, Medicare and Medicaid costs are projected to grow rapidly over the next 75 year. In fact, the first two tables at this link show that the cost of Medicare is projected to be greater than ALL federal receipts in 2085. This is over twice the cost that was projected in the prior budget. Chapter 5 explains the reason for the rapid rise in health care costs, stating:
In the base case, a continuation of the historical trend would see the per beneficiary cost of health care spending for Medicare, Medicaid, and private health care rising 2 percent per year faster than GDP per capita.
It goes on to list three major reforms being considered to slow this growth:
There are three broad reforms in the legislation under consideration in Congress that experts believe will produce significant savings relative to the historical trend: an excise tax on the highest-cost insurance plans will encourage substitution of more efficient plans with lower costs, while raising take-home pay; an independent payment advisory board will be empowered to suggest changes in Medicare and the health care system to improve the quality and value of its services; and an array of other delivery system reforms will gradually reduce costs.
These projections do not include any of these possible saving, however. As chapter 5 explains:
...but the baseline does not include these savings because the final form of the legislation was not resolved in time for the Administration to produce detailed estimates of its long-run effects.
Chapter 5 does go on to explore the projected effects of a number of alternative scenarios. They are summed up in the following table:
The accompanying text describes the fiscal gap as follows:
The fiscal gap is one measure of the size of the adjustment needed to preserve fiscal sustainability in the long run. It is defined as the increase in taxes or reduction in non-interest expenditures required to keep the long-run ratio of government debt to GDP at its current level if implemented immediately. The gap is usually measured as a percentage of GDP. The fiscal gap is calculated over a finite time period, and therefore it may understate the adjustment needed to achieve longer-run sustainability.
Table 5-2 shows fiscal gap calculations for the base case calculated over a 75-year horizon and for the various alternative scenarios described above. The fiscal gap in the base case is 8.0 percent of GDP, and it ranges in the alternative scenarios from 2.8 percent of GDP to 9.6 percent of GDP. In all cases, significant fiscal adjustments would be needed to achieve long-run sustainability.
As can be seen, the largest projected savings of 5.2 percent of GDP would come from cutting the average annual growth of health care costs from 2 percent to 0.5 percent above GDP per capita growth. The next largest projected savings would be just 2.1 percent of GDP if defense grows with inflation and nondefense grows with inflation plus population. Both are otherwise assumed to grow with GDP. In any event, both projected savings taken together would add up to 7.3 percent of GDP, still a bit short of the 8.0 percent of GDP baseline fiscal gap.

The actual numbers and sources for this and the following graph can be found at this link. As can be seen, receipts are projected to rise and spending is projected to drop over the next 10 years, causing the deficit to narrow to 4.2 percent of GDP by 2020. However, outlays are then projected to begin a steady rise, causing the deficit to reach a record 62.3 percent of GDP by 2085. This is projected to cause the debt held by the public to rise to 829.7 percent of GDP. This is over seven times the prior high of 108.7 percent of GDP reached in 1946, at the end of World War II. In addition, it is over double the level projected in the prior budget. The projections for this year and last year are the purple and green lines in the above graph.
Regarding the projected increase in the deficit and debt, Chapter 5 of the Analytical Perspectives says the following:
The key drivers of the long-range deficit are the Government’s major health and retirement programs: Medicare, Medicaid and Social Security.
Further on, it narrows this a bit, stating:
The most important single factor driving the long-run budget outlook is the growth of health care expenditures.
This growth in health care expenditures can be seen in the following graph which shows the projected growth in outlays according to the 2011 budget.

As can be seen, Medicare and Medicaid costs are projected to grow rapidly over the next 75 year. In fact, the first two tables at this link show that the cost of Medicare is projected to be greater than ALL federal receipts in 2085. This is over twice the cost that was projected in the prior budget. Chapter 5 explains the reason for the rapid rise in health care costs, stating:
In the base case, a continuation of the historical trend would see the per beneficiary cost of health care spending for Medicare, Medicaid, and private health care rising 2 percent per year faster than GDP per capita.
It goes on to list three major reforms being considered to slow this growth:
There are three broad reforms in the legislation under consideration in Congress that experts believe will produce significant savings relative to the historical trend: an excise tax on the highest-cost insurance plans will encourage substitution of more efficient plans with lower costs, while raising take-home pay; an independent payment advisory board will be empowered to suggest changes in Medicare and the health care system to improve the quality and value of its services; and an array of other delivery system reforms will gradually reduce costs.
These projections do not include any of these possible saving, however. As chapter 5 explains:
...but the baseline does not include these savings because the final form of the legislation was not resolved in time for the Administration to produce detailed estimates of its long-run effects.
Chapter 5 does go on to explore the projected effects of a number of alternative scenarios. They are summed up in the following table:
Table 5–2. FISCAL GAP UNDER ALTERNATIVE BUDGET SCENARIOS (Percent of GDP)

Baseline....................................................................  8.0
Health:
  Excess cost growth averages 1 percent.....................................  4.5
  Excess cost growth averages 1/2 percent...................................  2.8
Discretionary Outlays:
  Grow with inflation plus population.......................................  6.2
  Defense grows with inflation; nondefense grows with inflation + population  5.9
Revenues:
  Revenues exceed baseline by 2 percent of GDP..............................  6.4
  Revenues fall short of baseline by 2 percent of GDP.......................  9.6
Productivity:
  Productivity grows by 0.5 percent per year faster than the baseline.......  6.6
  Productivity grows by 0.5 percent per year slower than the baseline.......  9.6
Population:
  Fertility:
    2.3 births per woman....................................................  7.1
    1.7 births per woman....................................................  8.8
Immigration:
  1.3 million immigrants per year...........................................  7.5
  0.7 million immigrants per year...........................................  8.4
Mortality:
  Female life expectancy 82.7 years; male life expectancy 79.1 years in 2085  7.2
  Female life expectancy 89.9 years; male life expectancy 87.2 years in 2085  8.8
The accompanying text describes the fiscal gap as follows:
The fiscal gap is one measure of the size of the adjustment needed to preserve fiscal sustainability in the long run. It is defined as the increase in taxes or reduction in non-interest expenditures required to keep the long-run ratio of government debt to GDP at its current level if implemented immediately. The gap is usually measured as a percentage of GDP. The fiscal gap is calculated over a finite time period, and therefore it may understate the adjustment needed to achieve longer-run sustainability.
Table 5-2 shows fiscal gap calculations for the base case calculated over a 75-year horizon and for the various alternative scenarios described above. The fiscal gap in the base case is 8.0 percent of GDP, and it ranges in the alternative scenarios from 2.8 percent of GDP to 9.6 percent of GDP. In all cases, significant fiscal adjustments would be needed to achieve long-run sustainability.
As can be seen, the largest projected savings of 5.2 percent of GDP would come from cutting the average annual growth of health care costs from 2 percent to 0.5 percent above GDP per capita growth. The next largest projected savings would be just 2.1 percent of GDP if defense grows with inflation and nondefense grows with inflation plus population. Both are otherwise assumed to grow with GDP. In any event, both projected savings taken together would add up to 7.3 percent of GDP, still a bit short of the 8.0 percent of GDP baseline fiscal gap.
Comments
Post a Comment