Interest Cost of U.S. Treasury Debt
Following is an excerpt from a Wall Street Journal article from December 31, 2009:
The Treasury sold more than $2.1 trillion in notes and bonds this year, more than in the previous two years combined, to fund a widening budget shortfall and finance programs to rescue the banking system and support the economy.
Yet, despite the supply onslaught, buyers—from foreign central banks to U.S. households and domestic commercial banks—flocked to the sales. As a result, the government's borrowing costs fell to historic lows in 2009.
Regarding these borrowing costs, the Treasury Department posts the average interest rates on U.S. Treasury Securities at this link. This shows the monthly averages from 2001 through 2009 and was apparently used to create the graph at this link. The table for December 2009 shows that the average interest rates for Treasury Bills (which have a maturity of one year or less) fell to a mere 0.237 percent at the end of 2009, compared to 1.082 percent at the end of 2008. The average interest rates for all interest-bearing debt fell to 3.29 percent at the end of 2009, compared to 3.866 percent at end of 2008. This second pair of numbers is a good amount higher than the first pair since it includes longer-term debt paying at even higher rates.
The following graph gives a longer-term view of the average interest rates on U.S. treasury securities:
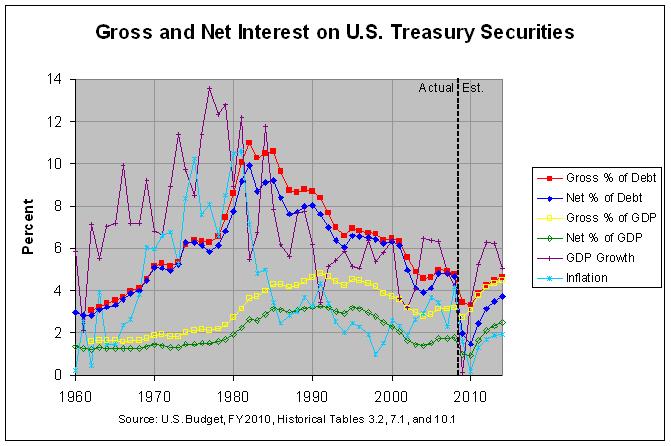
The actual numbers used to create this graph can be found at this link. The red line shows the average interest rate paid on the gross federal debt and the blue line shows the average interest rate paid on the debt held by the public (see the note and table at the bottom of this page for the difference between these two debts). As noted at the bottom of this page, the gross interest rates were calculated by dividing the gross interest by the average gross federal debt for each year. Similarly, the net interest rates were calculated by dividing the net interest by the average debt held by the public for each year.
The yellow and green lines are calculated the same as the red and blue line except that that the denominator used is the gross domestic product (GDP). Hence, the yellow line is the gross interest divided by the GDP for each year and the green line is the net interest divided by the GDP for each year.
The graph shows that, since 1962, the average interest rate on the gross debt has been slightly more than it has been on the debt held by the public. This difference reached a maximum of about one percent in the mid-eighties and is projected to be at about that level from 2009 to at least 2014. The two rates generally rose from 1962 to a high of 11 and 10 percent in 1982 and then declined. They are projected to reach a low in 2010 and then start increasing again.
The graph also shows the annual change in the GDP and the Composite Outlay Deflator as the purple and light blue lines, respectively. As can be seen, GDP grew a good bit faster than the average interest rates from 1962 to 1981 but grew somewhat slower from 1982 to 2002. On the other hand, inflation (as measured by the composite outlay deflator) grew at about as fast as the average interest rates from 1962 to 1981 but much slower after that. In fact, the following table shows the averages for all of these measurements from 1962 through 2008:
Hence, it is the case that, since 1962, the the average interest rate on the gross federal debt has been slightly above that for the debt held by the public. Also, both rates have been a bit below the growth in the GDP but well above the rate of inflation.
Finally, the graph shows that by 2014, the interest costs as a percentage of GDP are projected to rise to levels not seen since the late 1990s. However, the levels in the late 1990s were based on interest rates of over 6 percent whereas the levels in 2014 are based on lower rates of 4.5 and 2.5 percent respectively. This would suggest that higher rates of 6 percent or so would bring interest costs as a percentage of GDP to their highest level since at least 1962.
The Treasury sold more than $2.1 trillion in notes and bonds this year, more than in the previous two years combined, to fund a widening budget shortfall and finance programs to rescue the banking system and support the economy.
Yet, despite the supply onslaught, buyers—from foreign central banks to U.S. households and domestic commercial banks—flocked to the sales. As a result, the government's borrowing costs fell to historic lows in 2009.
Regarding these borrowing costs, the Treasury Department posts the average interest rates on U.S. Treasury Securities at this link. This shows the monthly averages from 2001 through 2009 and was apparently used to create the graph at this link. The table for December 2009 shows that the average interest rates for Treasury Bills (which have a maturity of one year or less) fell to a mere 0.237 percent at the end of 2009, compared to 1.082 percent at the end of 2008. The average interest rates for all interest-bearing debt fell to 3.29 percent at the end of 2009, compared to 3.866 percent at end of 2008. This second pair of numbers is a good amount higher than the first pair since it includes longer-term debt paying at even higher rates.
The following graph gives a longer-term view of the average interest rates on U.S. treasury securities:
The actual numbers used to create this graph can be found at this link. The red line shows the average interest rate paid on the gross federal debt and the blue line shows the average interest rate paid on the debt held by the public (see the note and table at the bottom of this page for the difference between these two debts). As noted at the bottom of this page, the gross interest rates were calculated by dividing the gross interest by the average gross federal debt for each year. Similarly, the net interest rates were calculated by dividing the net interest by the average debt held by the public for each year.
The yellow and green lines are calculated the same as the red and blue line except that that the denominator used is the gross domestic product (GDP). Hence, the yellow line is the gross interest divided by the GDP for each year and the green line is the net interest divided by the GDP for each year.
The graph shows that, since 1962, the average interest rate on the gross debt has been slightly more than it has been on the debt held by the public. This difference reached a maximum of about one percent in the mid-eighties and is projected to be at about that level from 2009 to at least 2014. The two rates generally rose from 1962 to a high of 11 and 10 percent in 1982 and then declined. They are projected to reach a low in 2010 and then start increasing again.
The graph also shows the annual change in the GDP and the Composite Outlay Deflator as the purple and light blue lines, respectively. As can be seen, GDP grew a good bit faster than the average interest rates from 1962 to 1981 but grew somewhat slower from 1982 to 2002. On the other hand, inflation (as measured by the composite outlay deflator) grew at about as fast as the average interest rates from 1962 to 1981 but much slower after that. In fact, the following table shows the averages for all of these measurements from 1962 through 2008:
Measurements from 1962 through 2008              Average
------------------------------------------------ -------
Annual increase in Gross Domestic Product (GDP).  7.251
Average interest rate on gross federal debt.....  6.482
Average interest rate on debt held by the public  6.007
Average increase in composite outlay deflator...  4.230
Hence, it is the case that, since 1962, the the average interest rate on the gross federal debt has been slightly above that for the debt held by the public. Also, both rates have been a bit below the growth in the GDP but well above the rate of inflation.
Finally, the graph shows that by 2014, the interest costs as a percentage of GDP are projected to rise to levels not seen since the late 1990s. However, the levels in the late 1990s were based on interest rates of over 6 percent whereas the levels in 2014 are based on lower rates of 4.5 and 2.5 percent respectively. This would suggest that higher rates of 6 percent or so would bring interest costs as a percentage of GDP to their highest level since at least 1962.


Comments
Post a Comment