Do Balanced Budgets Cause Depressions? (Part 2)
My prior post suggested that the initial events that lead to financial crises are more likely wars, not the periods of paying down the resultant debt. The following graph shows the federal debt held by the public during major wars since 1790:

The actual numbers and sources can be found at this link. The graph shows the federal debt as a percentage of GDP, as opposed to my prior post which deals with the current dollar amounts. The debt as a percentage of GDP gives a better measure of our ability to service the debt since the government receipts used to pay the interest have remained around 18 percent of GDP for the past 50-plus years (see the first graph at this link).
In any event, the graph shows that there was a tremendous growth in the debt during the Civil War, World War I, and World War II. The growth in debt was much more rapid than any paydown in debt after the war. The growth in debt during the Mexican-American War and the War of 1812 was much more modest but the paydown in debt immediately following those wars was even less. Hence, the graph does agree with the conclusions of my prior post. Looking at the debt as a percentage of GDP does make the paydown in debt appear much more substantial but it still, for the most part, appears to be just a paydown of the tremendous debt run up during war years.
The relationship between the debt and war years reminded me of a similar relationship that I had noticed years ago. The following graph shows the CPI (Consumer Price Index) and M2 Money Supply since about 1800:
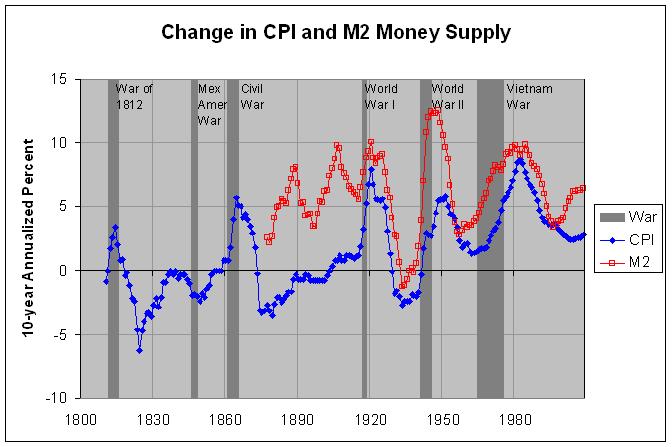
The actual numbers and sources for this graph can be found at this link. As can be seen, inflation has tended to increase during major wars though it did not during the smaller Mexican-War War. In addition, the growth in the M2 money supply has tended to increase during major wars since at least World War I. In fact, there appears to have been a positive correlation between the growth in the M2 money supply and inflation since World War I though this relationship seems to have broken down somewhat since about 2000. I had a discussion about this with Rodger M. Mitchell (who I mentioned in my prior post) at this link. He felt that the use of ten-year spans to "smooth" the data had in fact "ruined" it. But, as I explain in my comment of October 11th, even the graphs using five or one-year spans (shown here) show a correlation.
I also mentioned in my comment of October 7th that Thayer's claim that the six financial collapses that he lists "have been the only major depressions in U.S. history" is questionable. As I pointed out, I have seen 1907 mentioned as a possible depression in several places, including this article. Another article mentions that the U.S suffered a serious economic downturn at the start of the 1920s. The list of recessions on wikipedia lists the Depression of 1920-21 and the Panic of 1907. It also lists the first five of Thayer's six collapses (1819, 1837, 1857, 1873, 1893) as Panics. The sixth collapse in 1929 is, of course, listed as the Great Depression.
The Panic of 1907 and Depression of 1920-21 are significant in another way. Treasury data shows that the Panic of 1907 was preceded by rising debt, with the debt increasing from 1898 to 1913. The huge debt run up during World War I did decrease from 1919 to 1930 but, as this article mentions, that was through the recovery. Hence, the Panic of 1907 contradicts the notion that all depressions are preceded by decreases in debt and the Depression of 1920-21 contradicts the notion that deficit spending is an absolute necessity for recovery.
In any event, the above graphs again suggest that the initial events that lead to many financial crises are wars, not periods of paying down the resultant debt. For that reason, it would seem that our higher priority should be to find ways to prevent wars and their resulting cost in lives and treasure.
The actual numbers and sources can be found at this link. The graph shows the federal debt as a percentage of GDP, as opposed to my prior post which deals with the current dollar amounts. The debt as a percentage of GDP gives a better measure of our ability to service the debt since the government receipts used to pay the interest have remained around 18 percent of GDP for the past 50-plus years (see the first graph at this link).
In any event, the graph shows that there was a tremendous growth in the debt during the Civil War, World War I, and World War II. The growth in debt was much more rapid than any paydown in debt after the war. The growth in debt during the Mexican-American War and the War of 1812 was much more modest but the paydown in debt immediately following those wars was even less. Hence, the graph does agree with the conclusions of my prior post. Looking at the debt as a percentage of GDP does make the paydown in debt appear much more substantial but it still, for the most part, appears to be just a paydown of the tremendous debt run up during war years.
The relationship between the debt and war years reminded me of a similar relationship that I had noticed years ago. The following graph shows the CPI (Consumer Price Index) and M2 Money Supply since about 1800:
The actual numbers and sources for this graph can be found at this link. As can be seen, inflation has tended to increase during major wars though it did not during the smaller Mexican-War War. In addition, the growth in the M2 money supply has tended to increase during major wars since at least World War I. In fact, there appears to have been a positive correlation between the growth in the M2 money supply and inflation since World War I though this relationship seems to have broken down somewhat since about 2000. I had a discussion about this with Rodger M. Mitchell (who I mentioned in my prior post) at this link. He felt that the use of ten-year spans to "smooth" the data had in fact "ruined" it. But, as I explain in my comment of October 11th, even the graphs using five or one-year spans (shown here) show a correlation.
I also mentioned in my comment of October 7th that Thayer's claim that the six financial collapses that he lists "have been the only major depressions in U.S. history" is questionable. As I pointed out, I have seen 1907 mentioned as a possible depression in several places, including this article. Another article mentions that the U.S suffered a serious economic downturn at the start of the 1920s. The list of recessions on wikipedia lists the Depression of 1920-21 and the Panic of 1907. It also lists the first five of Thayer's six collapses (1819, 1837, 1857, 1873, 1893) as Panics. The sixth collapse in 1929 is, of course, listed as the Great Depression.
The Panic of 1907 and Depression of 1920-21 are significant in another way. Treasury data shows that the Panic of 1907 was preceded by rising debt, with the debt increasing from 1898 to 1913. The huge debt run up during World War I did decrease from 1919 to 1930 but, as this article mentions, that was through the recovery. Hence, the Panic of 1907 contradicts the notion that all depressions are preceded by decreases in debt and the Depression of 1920-21 contradicts the notion that deficit spending is an absolute necessity for recovery.
In any event, the above graphs again suggest that the initial events that lead to many financial crises are wars, not periods of paying down the resultant debt. For that reason, it would seem that our higher priority should be to find ways to prevent wars and their resulting cost in lives and treasure.


"The debt as a percentage of GDP gives a better measure of our ability to service the debt since the government receipts used to pay the interest have remained around 18 percent of GDP for the past 50-plus years."
ReplyDeleteThe government's ability to service its debt has nothing to do with GDP.
Rodger Malcolm Mitchell
"[...]the above graphs again suggest that the initial events that lead to many financial crises are wars, not periods of paying down the resultant debt."
ReplyDeleteWhat's missing from your hypothesis is the mechanism by which an approaching war causes a recession. Further, the debt/GDP ratio is meaningless. Debt is the cumulative, net debt from the beginnings of the nation; GDP is a one-year measure. The two are unrelated. See: http://rodgermmitchell.wordpress.com/2009/11/08/federal-debtgdp-a-useless-ratio/
Further, the debt/GDP ratio is meaningless. Debt is the cumulative, net debt from the beginnings of the nation; GDP is a one-year measure. The two are unrelated.
ReplyDeleteDebt is cumulative and GDP is a one-year measure. However, the annual interest that must be paid on that cumulative debt is, like the GDP, a one-year measure. Otherwise, you could just as well say that one's personal debt as a ratio of their income is meaningless. As I mentioned, the government's receipts have remained around 18 percent of GDP for the past 50-plus years (see the first graph at http://www.econdataus.com/def10.html). Hence, as GDP has risen, so have receipts. A portion of these receipts are then required to pay the interest on the debt. One can calculate the portion from the following formula:
(debt/GDP) * (GDP/receipts) * (interest/debt) = (interest/receipts)
If (debt/GDP) is 0.5 (50 percent), (GDP/receipts) remains at (100/18) and the interest rate (interest/debt) is 0.05 (5 percent) then (interest/receipts) will be about 0.139 (13.9 percent). If (debt/GDP) doubles to 100 percent and the other two factors remain constant, (interest/receipts) will likewise double to 27.8 percent. As a result, twice as much of the receipts will be required to pay the interest on the cumulative debt. Hence, debt as a percentage of GDP is a major factor in our ability to service that debt.