Fiscal Year 2010 Budget Overview Document
A New Era of Responsibility: Renewing America’s Promise, provides a description of the Obama Administration’s fiscal policies and major budgetary initiatives. This document is an overview of the full Fiscal Year 2010 Budget expected to be released this spring.
The overview contains 9 summary tables which give actual budget numbers for 2008 and projected numbers for 2009 through 2019. These numbers can be combined with historical budget numbers from the prior budget to look at historical and projected budget data from 1940 through 2019. The following graph shows selected measures of the deficit since 1970:
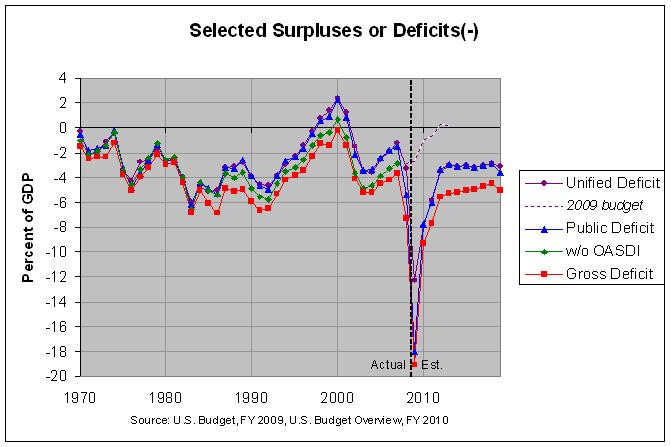
The most commonly discussed measure of the deficit is the unified deficit, shown in purple. The graph shows the actual values of the unified deficit through 2008 and projected values from 2009 forward. In addition, the dotted purple line shows the projected values of the unified deficit from last year's budget. The actual numbers and sources can be found at this link.
As can be seen, the extraordinary financial crisis has caused the outlook for the unified deficit to change radically. The prior budget projected that it would become a surplus in 2012 while the current budget projects that it will skyrocket to $1.75 trillion this year and decrease to $581 billion by 2012.
In any event, the graph also shows the change in the debt held by the public (the blue line), referred to as the public deficit. This is usually very close to the unified deficit as the government must generally make up for the difference between receipts and outlays by borrowing from the public. However, the graph and table show that the debt held by the public is projected to increase by $2.56 trillion in 2009, well over the projected unified deficit of $1.75 trillion. Table S-9 in the overview shows that this difference is chiefly due to Direct loan accounts ($482 billion), Troubled Asset Relief Program (TARP) equity purchase accounts ($202 billion), and Financing accounts for potential additional financial stabilization efforts ($432 billion).
Finally, the graph shows the change in the gross federal debt (the red line), referred to as the gross deficit. This is equal to the public deficit plus those monies borrowed from Social Security and the other trust funds. As can be seen, the gross deficit is projected to reach $2.72 trillion in 2009, descend to just under a trillion dollars per year by 2012, and maintain that general level until 2019.
Regardless of the significance of the deficit, the federal debt is arguably more critical. Afterall, it is the debt, not the deficit, that we are paying interest on every year. The following graph shows selected measures of the U.S. debt since 1940:
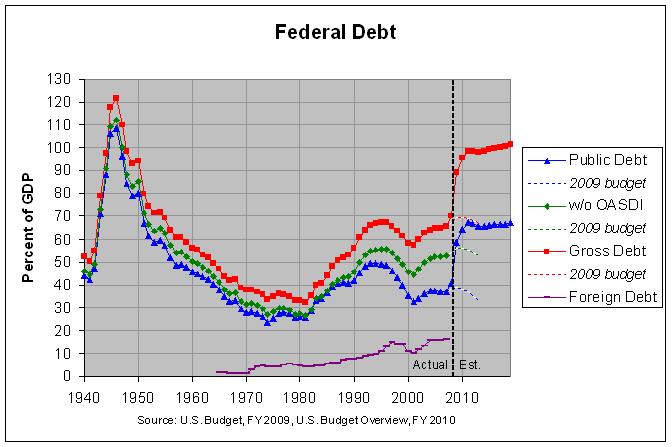
The actual numbers and sources for this graph can be found at this link. As can be seen, the gross federal debt is projected to jump from 70.2% of GDP to 89.2% of GDP in 2009 and reach 98.3% of GDP by 2011. As the graph shows, that is not far from the historic peak that we reached in World War II. Unlike the end of that war, however, there is no sharp drop in the debt to GDP ratio when the current economy improves. That is because the budget is projected to stay well in deficit through 2019 with unified deficits around 3 percent of GDP and gross deficits around 5 percent of GDP. That's very unlike the end of World War II when the drop in war expenditures allowed the budget to achieve approximate balance for the next decade or more.
On the positive side, the overview contends that these numbers are more realistic than some prior budgets. On page 36, it states:
This Budget, therefore, provides a projected cost for the wars in Iraq and Afghanistan; does not assume that all of the 2001 and 2003 tax legislation magically disappears at the end of 2010; does not allow the alternative minimum tax to take over the tax code, which almost every observer agrees is unrealistic; recognizes the statistical likelihood of natural disasters instead of assuming that there will be no disasters over the next decade; includes a contingent reserve as a placeholder in case further legislative action becomes necessary to stabilize the financial system; and provides a 10-year rather than a 5-year look into our fiscal situation.
Of course, projections are likely to become less and less accurate the further into the future they extend. Look at the radical change in projections that the current financial crisis caused in just one year. Still, it seems responsible to at least attempt to plan for the future, especially the relatively near future of ten years. Even more important, it seems critical to provide the public with numbers that are as realistic as possible. The more accurate a picture that the electorate has of our current situation, the more likely they are to support those actions which will best address it.


Comments
Post a Comment