Worst Job Losses Since 1945?
Nonfarm payroll employment declined sharply in December, and the unemployment rate rose from 6.8 to 7.2 percent, the Bureau of Labor Statistics of the U.S. Department of Labor reported today. Payroll employment fell by 524,000 over the month and by 1.9 million over the last 4 months of 2008. In December, job losses were large and widespread across most major industry sectors.
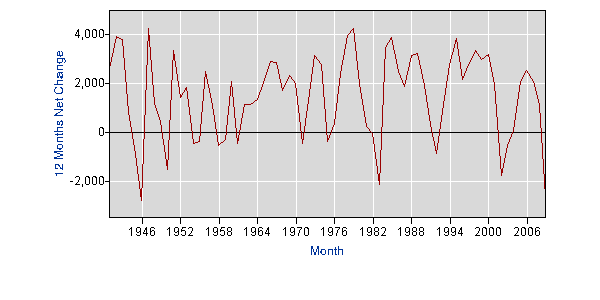
A number of news articles stated this to be the worst job losses since 1945. For example, a Wall Street Journal article was titled "Yearly Job Loss Worst Since 1945" and a CNN Money.com article was titled "Worst year for jobs since '45". In fact, the preliminary figures for the loss of nonfarm jobs in 2008 is 2.589 million jobs and this is the highest figure since 2.75 million jobs were lost in 1945. The following graph from the BLS shows the annual nonfarm job losses since 1940:

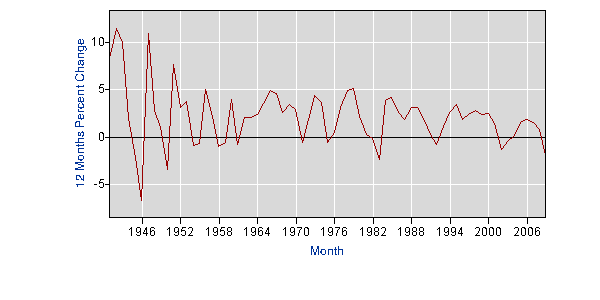
The actual numbers and sources for this and the following graph can be found at this link. As can be seen, the job loss in 2008 was slightly more than the loss in 1982 and was the worst loss since 1945. However, some have pointed out that the labor force has grown greatly since 1982 and that the 2008 job loss is actually less in percentage terms. The following graph from the BLS shows the annual nonfarm job losses since 1940 in terms of percentage:

As can be seen, the 2008 job loss of 1.9 percent was less than the 1982 job loss of 2.3 percent and significantly less than the 1945 and 1949 job losses of 6.6 and 3.4 percent, respectively.
However, the CNN Money.com article did address this concern in the following excerpt:
"We have a bigger economy now, but even on a proportional basis, the last months have been the worst since [1945]," said Kurt Karl, head of economic research at Swiss Re. "It's just an enormous acceleration of job losses."
This acceleration is shown in a chart included with the article and is reflected by the Employment Situation report which states that payroll employment fell by 1.9 million over the last 4 months of 2008.
One other way in which the current job losses seem to rate very badly is over the longer term. The tables at this link show that only about three million jobs have been created in the past eight years. This is an increase of just 2.3 percent, the lowest since before the 1939 to 1947 period (the earliest covered by the BLS data). The lowest since then was 7.1 percent from 1952 to 1960. The 2.3 percent figure does measure from a peak to the current low but this is still a historically low figure.
I read your site on Jimmy Carter's job losses,how do you give Carter full blame for the 82 recession?The right's constant Carter bashing with NO Dems ever fighting back is just cowardly,Carter had to repair the damages of the crook Dick Nixon,a 15 year war that was never payed for,(also we bankrolled the French in the Far East),Nixon's terrible economic and energy policies,going off the Gold Standard,HOW THE HELL DO PEOPLE GET AWAY WITH BASHING CARTER?
ReplyDeleteI assume that you're referring to my reply at http://home.att.net/~rdavis2/joblos08.html that "even if you were to give Carter the full blame for the 80-82 recession, he achieved far better annualized job growth (1.8 percent) over a full business cycle than did George W. Bush (0.6 percent)". However, I expand at this link that "I know of no evidence that all effects require the passage of two years to begin" and that "skipping the first two years might be the most reasonable number to look at as it makes no assumptions about which president's policy has the largest effect during this period". In addition, I state that "it makes sense to look at the job growth numbers for each party over an entire business cycle". By both of these latter measures, Carter does about as well as any other President since Truman. In any event, I have seen no evidence that Carter was less qualified than any other President since Truman and agree that he does not deserve the partisan bashing that he gets from some people.
ReplyDelete