The Budget and Economic Outlook: Fiscal Years 2009 to 2019
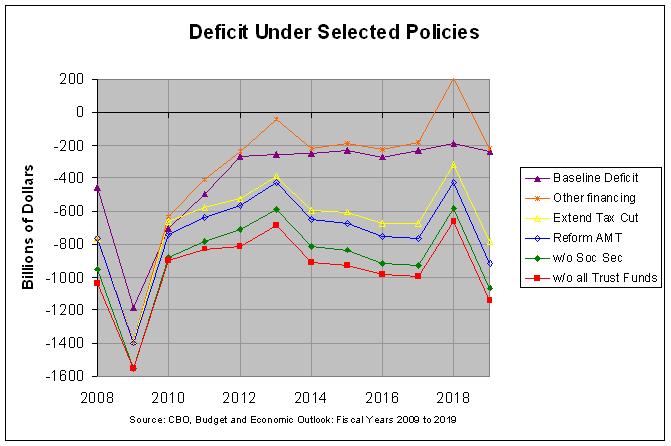
The actual numbers and sources for this and the following graph can be found at this link. As can be seen, the baseline deficit (the purple line) is projected to plunge to $1.2 trillion in 2009 and recover over the next three years, stabilizing to just over $200 billion per year from 2012 through 2019. However, other means of financing will cause the debt held by the public to increase an additional $313 billion in 2008 and $204 billion in 2009. The report explains this other financing on pages 18 to 20 as follows:
Federal Debt. In most years, the amount of debt that the Treasury issues roughly equals the annual budget deficit, although a number of other factors also affect the government’s need to borrow money from the public. In a typical year, those factors might total $10 billion to $30 billion. However, the Treasury’s actions aimed at stabilizing the financial markets added more than $300 billion to the Treasury’s borrowing needs in 2008 (on top of the borrowing necessary to finance the budget deficit) and will boost them by about an estimated $200 billion in 2009 (see Table 6).
In 2008, the Treasury borrowed about $300 billion to deposit at the Federal Reserve to help it finance initiatives to enhance liquidity in the credit markets. CBO anticipates that the Treasury will withdraw those balances later this year, thereby reducing borrowing needs for 2009 by the amount deposited last year.
In the other direction, the cash flows for two programs will lift the Treasury’s borrowing needs by more than $700 billion. For the TARP, CBO’s baseline includes outlays of about $180 billion for 2009, but the Treasury is likely to have to borrow $460 billion more than that to cover the capital purchases, loans, and other activities of the program this year. Additionally, the Treasury is purchasing mortgage-backed securities from the private market; CBO assumes that such purchases will total nearly $250 billion this year, thereby necessitating additional borrowing of a similar amount (although the budgetary impact of the purchases, shown as an estimated subsidy amount in 2009, is relatively small).
One other factor affects the gap between the projected deficit and anticipated borrowing. Although CBO is treating Fannie Mae and Freddie Mac as part of the federal budget, most of the cost recorded for 2009 reflects a present-value calculation rather than a cash outflow; consequently, the projected deficit overstates borrowing requirements in that respect by about $220 billion.
This explains the other financing in 2008 and 2009. However, Table 6 on page 19 shows that there will be an additional inflow to the Treasury from 2010 through 2019. This inflow will be especially large in 2013 ($215 billion) and 2018 ($396 billion). I did not find much additional explanation of this inflow in the report but the Table 6 shows that most of it is in the TARP program. I assume that it comes from the selling of assets and/or repayment of loans. In any case, the baseline deficit adjusted by these other means of financing is shown by the orange line in the graph above. As can be seen, the large inflow in 2013 leads to a relatively small deficit of $42 billion and the large inflow in 2018 leads to a surplus of $208 billion.
This adjusted baseline deficit makes the assumption that the Bush tax cuts expire as currently scheduled and that the Alternative Minimum Tax (AMT) is not adjusted as it has been in the past. The report explains this on pages 24 and 25 as follows:
Revenues. The baseline assumes that the major provisions of the Economic Growth and Tax Relief Reconciliation Act of 2001 and the Jobs and Growth Tax Relief Reconciliation Act of 2003—such as the introduction of the 10 percent tax bracket, increases in the child tax credit, the repeal of the estate tax, and lower rates on capital gains and dividends—will expire as scheduled at the end of 2010. On balance, the tax provisions that are set to expire during the 10-year projection period reduce revenues; thus, under a scenario in which they were extended, projected revenues would be lower than the amounts indicated in the current baseline. For example, if all expiring tax provisions (except those related to the amount of the exemption for the AMT) were extended, total revenues over the 2010–2019 period would be about $3.0 trillion lower than in the projection in the current baseline.
Another change in policy that could affect revenues involves the modification of the AMT, which many observers believe will not be maintained in its current form. Because the AMT’s exemption amount and brackets are not indexed for inflation, the impact of the tax will grow in coming years as more taxpayers become subject to it. If the AMT was indexed for inflation after 2008 and no other changes were made to the tax code, federal revenues over the next 10 years would be about $0.6 trillion lower than the amount in the baseline.
Because the number of taxpayers who are subject to the AMT will depend on whether the tax provisions originally enacted in 2001 and 2003 remain in effect, the combination of indexing the AMT for inflation and extending the expiring provisions would reduce revenues by more than the sum of the effects of each policy enacted alone. The interactive effect would lower revenues by an additional $0.6 trillion between 2011 and 2019.
The yellow line in the graph above shows the projected adjusted baseline deficit (the annual increase in the debt held by the public) if the Bush tax cuts are extended. As can be seen, this would have a relatively large effect, growing from $170 billion in 2011 to $568 billion in 2019. The blue line shows the additional effect of reforming AMT such that it is indexed for inflation. It would have a much smaller effect, growing from $36 billion in 2012 to $131 billion in 2019. The interactive effect of indexing the AMT for inflation and extending the expiring provisions mentioned in the prior paragraph is not shown in the graph above but is relatively small, similar in size to the effect of just indexing the AMT for inflation (the gap between the yellow and blue lines).
In any event, the deficit shown by the blue line (adjusted for other financing, extending the tax cuts, and reforming the AMT) includes surpluses borrowed from the Social Security trust fund. The green line shows the projected deficit if these surpluses were excluded. The red line shows the projected deficit if the surpluses borrowed from other trust funds were also excluded. That is, the red line shows the projected deficit if other financing, extending the Bush tax cuts, reforming AMT, and borrowing from the Social Security and other trust funds are also included. This would be the increase in the gross federal debt under these conditions.
The following graph shows the projected gross federal debt under the baseline and selected policy alternatives as a percentage of GDP:
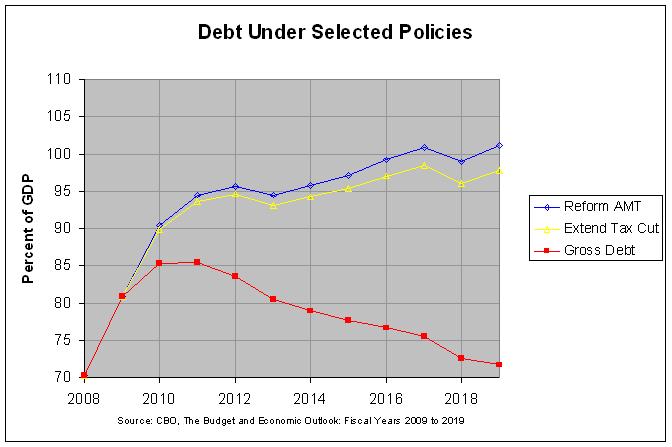
As can be seen, the gross federal debt is projected to increase sharply from 70.2 percent of GDP in 2008 to 85.4 percent of GDP in 2011. It is then projected to decrease steadily to 71.7 percent of GDP in 2019, nearly recovering to its 2008 level. If the Bush tax cuts are extended, however, the gross federal debt is projected to continue its increase, jumping to 93.6 percent of GDP in 2011 and growing to 97.7 percent of GDP by 2019. If the AMT is also indexed for inflation, the debt is projected to increase to 101.1 percent of GDP by 2019. This would approach the high of 121.7 percent of GDP reached in 1946 at the end of World War II. Unfortunately, there is no event similar to the end of a war that is projected to help constrain deficits. On the contrary, the rising costs of the aging of the population is likely to create more budget pressures. On page 31, the report says the following:
High deficits in the near term may be inevitable in the face of the financial crisis and severe economic weakness, However, once the nation gets past this downturn, it will still face significant fiscal challenges posed by rising health care costs and the aging of the population. Continued large deficits and the resulting increases in federal debt over time would probably constrain long-term economic growth by reducing national savings and investment, which in turn would cause productivity and wage growth to gradually slow.
Hence, it seems that we need to carefully consider the cost of extending the Bush tax cuts as well as the rising cost of health care and the aging of the population.


Comments
Post a Comment