Balance Sheet of Households and Nonprofit Organizations
The households and nonprofit organizations sector consists of individual households (including farm households) and nonprofit organizations such as charitable organizations, private foundations, schools, churches, labor unions, and hospitals. Nonprofits account for about 6 percent of the sector’s total financial assets, according to recent estimates, but they own a larger share of some of the individual financial instruments held by the sector.
The following graph shows this sector's assets since 1952 in trillions of 2007 dollars:
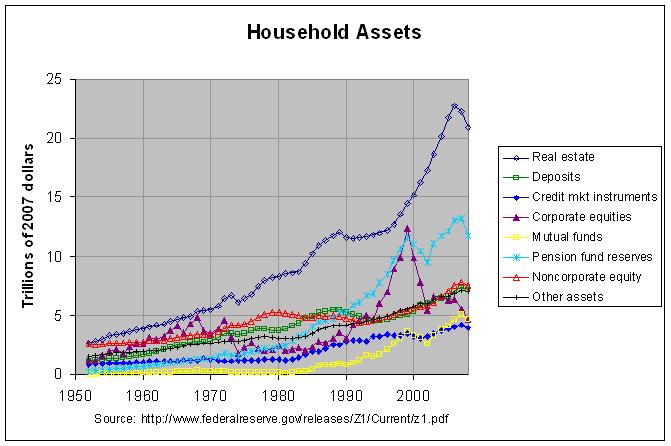
The actual numbers and their sources can be found at this link. The values for 2008 are through the second quarter and all other values are through the end of the year. As can be seen, corporate equities peaked at the end of 1999 and are currently about where they were in 1994. Mutual funds and pension fund reserves likewise peaked in 1999 but are currently above that peak (though just barely for pension fund reserves).
The graph also shows that real estate started rising rapidly in about 1998 and peaked at the end of 2006. In retrospect, it does not seem surprising that this rapid increase proved to be unsustainable. In any case, the correction in real estate will hopefully be closer to that of mutual funds and pension fund reserves than of corporate equities. Being a somewhat more stable asset class, this would seem likely.
The following graph shows the total of all assets (the green line) and the total liabilities against those assets (the red line). It also shows the difference between these two values, net worth (the blue line):
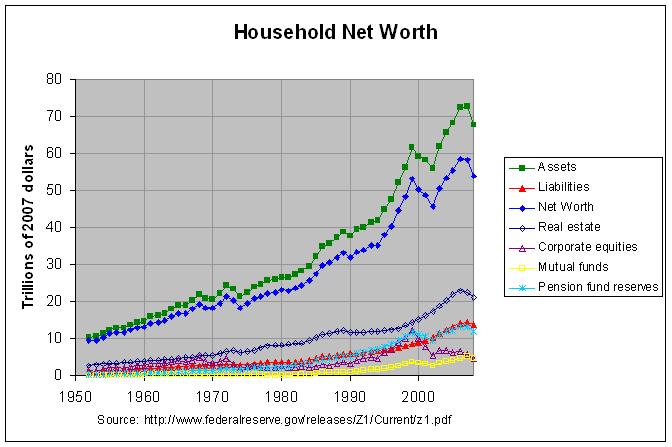
As can be seen, real assets and net worth have fallen sharply in the first two quarters of 2008. In fact, real net worth is currently just slightly above the peak that it reached at the end of 1999.
The prior two graphs show assets and liabilities corrected for inflation. To estimate these values per-capita, one needs to divide them by the current population. The following graph shows the values in the prior graph divided by the year-end U.S. population:
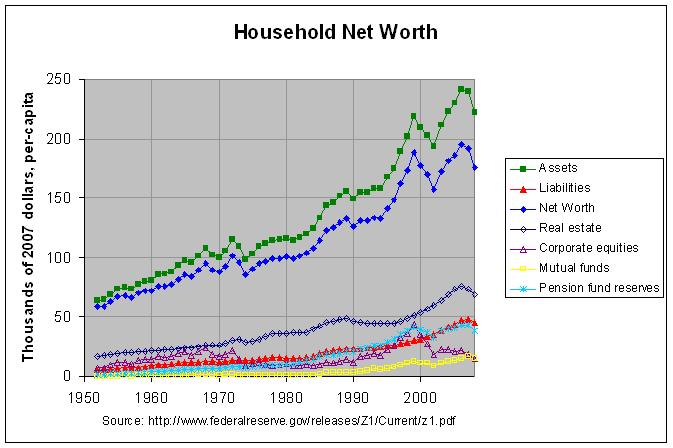
As can be seen, real per-capita net worth is currently below the peak that it reached at the end of 1999. In fact, it's at about the level that it was the year before and the year after this peak.


I'd be interested to see the net worth per capita if you added government liabilities per capita to the other liabilities...
ReplyDeleteGood suggestion. $175,000 is every American's share of the US government's approximate $53 trillion in current obligations according to this link. Subtracting this from the per-capita net worth of $176,076 from this link gives a per-capita net-worth, including government, of $1,076. Don't spend it all in one place!
ReplyDeleteIt is quite clear that the national debt is basically owed to richest household in the USA and like all usurers they will constantly demand a greater and greater share of what everyone else produces, They want tax cuts, hard money, high interest rates and balanced budgets, They want all this in the name of the greater good. When they voluntarily name the USA as the major beneficiary of their estates so that we all have less national debt, can we say they are really interested in the well being of the USA.
ReplyDeletegotothomas@aol.com