Job Growth Under Bush and Prior Presidents (through June 2008)
Note: The following blog entry has been updated at this link:
A March 16th New York Times editorial titled Through Bush-Colored Glasses alleged that Bush painted a false picture of the economy in a recent speech. Following is an excerpt:
Mr. Bush boasted about 52 consecutive months of job growth during his presidency. What matters is the magnitude of growth, not ticks on a calendar. The economic expansion under Mr. Bush — which it is safe to assume is now over — produced job growth of 4.2 percent. That is the worst performance over a business cycle since the government started keeping track in 1945.
I haven't calculated the job growth per business cycle but I have looked at the growth in employment over every presidential term since 1949. The following table shows the monthly average change in population, the labor force, employment according to the Household Survey, total nonfarm employment, and total private employment over every presidential term since 1949, along with the unemployment rate at the beginning of each term:
CHANGE IN POPULATION, LABOR FORCE, AND EMPLOYMENT BY PRESIDENTIAL TERM (in thousands)

                     Monthly Average Change (in thousands)
                     --------------------------------------------          Unemploy-
                        Popu-    Labor Househld  Nonfarm  Private   No. of      ment
President    Mo Year   lation    Force   Survey Employed Employed   Months      Rate
----------- --- ---- -------- -------- -------- -------- -------- -------- ---------
Roosevelt   Jan 1941                               154.6    117.4       48
Truman      Jan 1945                                57.8     65.3       48
  "         Jan 1949     63.9     55.6     71.4    114.0     95.2       48       4.3
Eisenhower  Jan 1953    104.8     62.3     42.3     57.1     39.9       48       2.9
  "         Jan 1957    136.0     83.7     44.7     16.6     -3.1       48       4.2
Kennedy     Jan 1961    156.1     65.0     87.9    122.9     94.3       48       6.6
Johnson     Jan 1965    159.9    124.0    141.8    205.3    158.0       48       4.9
Nixon       Jan 1969    258.3    165.9    132.4    128.8     97.9       48       3.4
Nixon/Ford  Jan 1973    249.3    202.5    141.0    105.7     77.2       48       4.9
Carter      Jan 1977    237.8    225.4    208.9    215.4    188.2       48       7.5
Reagan      Jan 1981    172.5    139.6    132.2    110.9    111.4       48       7.5
  "         Jan 1985    172.1    180.5    216.8    224.6    194.6       48       7.3
G.H. Bush   Jan 1989    173.3    104.4     49.3     54.0     30.5       48       5.4
Clinton     Jan 1993    173.4    147.0    192.1    239.7    225.3       48       7.3
  "         Jan 1997    241.7    173.8    197.5    234.1    208.3       48       5.3
G.W. Bush   Jan 2001    228.1     87.1     51.0      0.1    -18.8       48       4.2
  "         Jan 2005    214.4    156.3    138.2    126.0    108.5       41       5.2
            Jun 2008                                                             5.5
Following is a graphical representation of the above numbers:
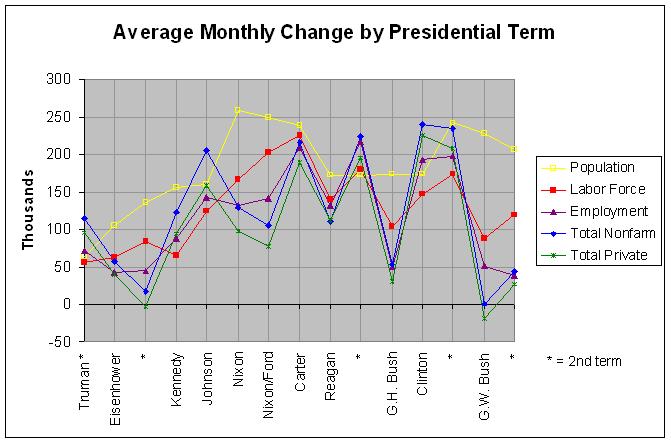
Additional numbers and the sources can be found at http://www.econdataus.com/employ08.html. As explained in my post of March 16, one must be careful in comparing changes in employment using the Household Survey. This extends to changes in the population and labor force, also from the Household Survey. Still, the job growth of nonfarm and private jobs (from the Payroll Survey) in Bush's first term was the worst since at least 1941. Taking both of Bush's terms together (through June 2008), the average monthly growth in household survey, nonfarm, and private employment were 91.2, 58.1, and 39.9 thousand, respectively. For nonfarm and private employment, this was the second worst since Eisenhower with Bush's father's term being the worst.
The above graph and table show at least one other interesting fact. They show 15 presidential terms since 1949. In almost every term of a Democratic president, the growth in household survey, nonfarm, and private employment was greater than the growth in the labor force. Conversely, in almost every term of a Republican president, the growth in household survey, nonfarm, and private employment was less than the growth in the labor force. The only two exceptions in the 15 terms were Carter and Reagan's second term.
A related fact is that the unemployment rate went down during almost every term of a Democratic president and up during almost every term of a Republican president since 1949. This follows from the prior fact because the unemployment rate equals the unemployed (labor force minus the employed) divided by the labor force from the Household Survey. In any case, the only exceptions to this second fact was Carter (when the unemployment rate stayed about the same) and both terms of Reagan. Of course, the unemployment rate is doubtlessly affected by the majorities of both houses and many other facts. Still, this apparent relationship to the party of the current president would seem worthy of some additional study.


Comments
Post a Comment