Who Will See Their Taxes Go Up under the Final GOP Tax Bill? (Part 2)
Taxpayer Examples Cited by Supporters of the Tax Bill
In my last post, I looked at several groups of taxpayers who would pay higher taxes under the new GOP tax bill. The Committee on Rules has posted a Summary of the bill, a Joint Explanatory Statement, and the full bill. Since then, however, it seems like Republican members of Congress are focusing more and more on just a couple of examples that show taxpayers who will receive large tax cuts. For example, a Washington Examiner article quotes Mitch McConnell reading an outline of a possible script for an advertisement that he expects will air:
“Here’s the commercial against Joe Manchin: ‘Head of household, family of four, making $73,000 a year, gets a $2,000 tax reduction. Now maybe Sen. Manchin that doesn’t sound like a lot of money to you, but for me it’s a 58 percent reduction in my taxes; 58 percent,’” McConnell said, playing the role of ad voiceover. “Or Sen. Heitkamp: ‘Maybe $1,300 doesn’t sound like a lot to you, but I’m a single mom with one child making $41,000 a year, and that’s a 73 percent reduction in my tax bill.’”
Searching for 73,000 and 41,000 in the December 19 Congressional Record shows 11 and 7 occurrences of those two examples, respectively. In addition, there's a Twitter hash #2059more for the tax cut calculated for the $73,000 example. In fact, these two examples are the first two of three taxpayer examples that were released in November 21st by the Senate Committee on Finance.
Because of the continued focus on these two examples, it may help to looks at variations of these examples to show taxpayers who will pay higher taxes under the new bill. Following is information for these two examples as generated by the interactive application at this link:
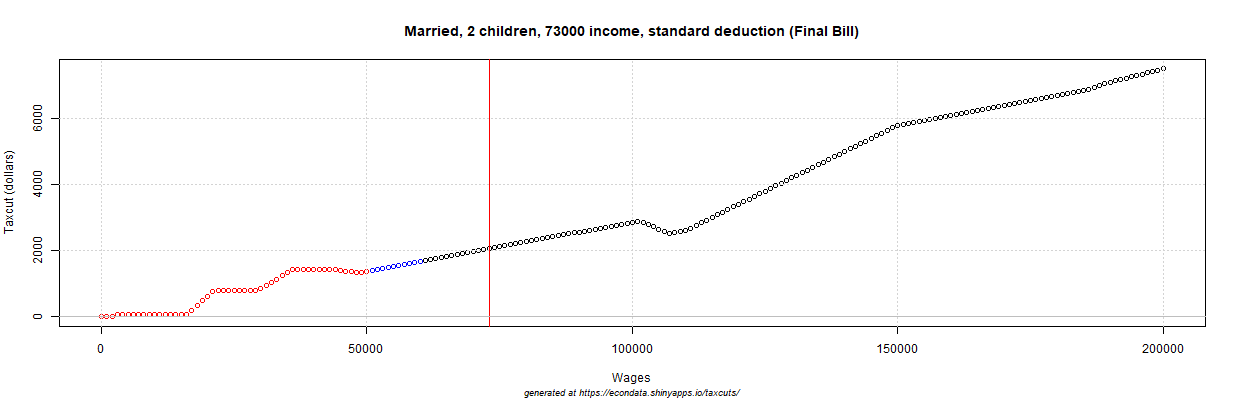
Married, 2 children, 73000 income, standard deduction

         Names    Taxes Released After_Tax
1 Current 2018  3,557.5           69,442.5
2   Final Bill  1,499.0           71,501.0
3       Change -2,058.5    -2059   2,058.5
4     % Change    -57.9                3.0
|
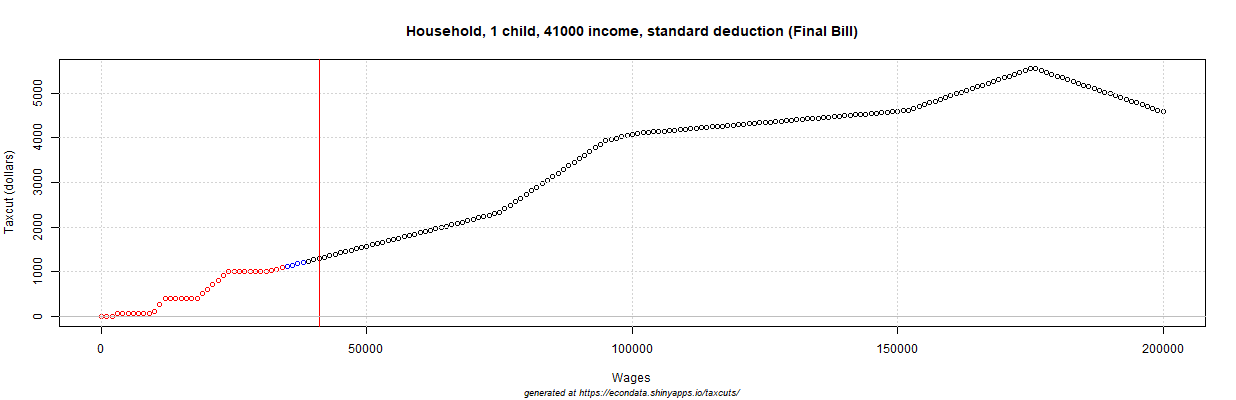
Household, 1 child, 41000 income, standard deduction

         Names    Taxes Released After_Tax
1 Current 2018  1,792.5           39,207.5
2   Final Bill    488.0           40,512.0
3       Change -1,304.5            1,304.5
4     % Change    -72.8                3.3
|
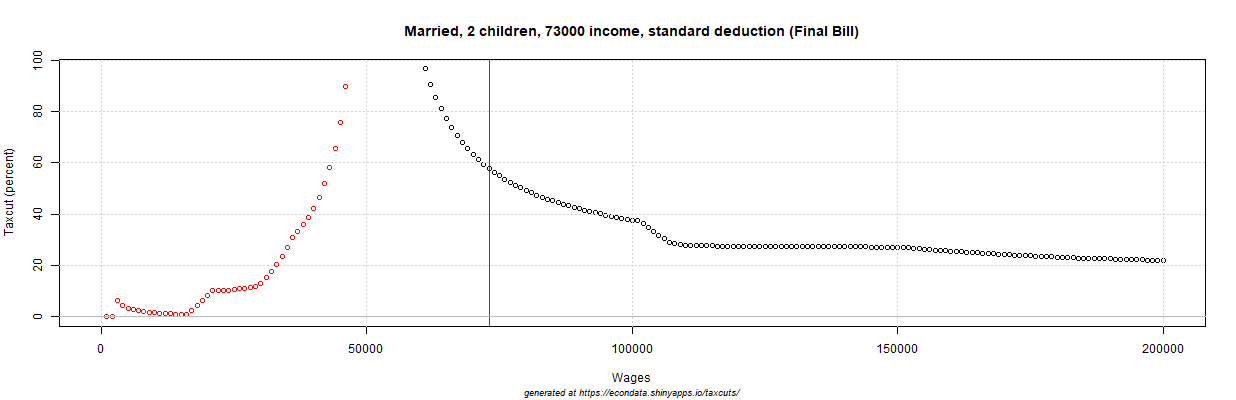
Married, 2 children, 73000 income, standard deduction

                      Tax Plan     2018 Final Bill   Change
1  --------------------------- --------   -------- --------
2  Wages, salaries, tips, etc.   73,000     73,000        0
3   Tax-deferred contributions        0          0        0
4                   Exemptions  -16,600          0   16,600
5          Standard deductions  -13,000    -24,000  -11,000
6          Itemized deductions        0          0        0
7  --------------------------- --------   -------- --------
8                      Medical        0          0        0
9        State and local taxes        0          0        0
10           Real estate taxes        0          0        0
11      Home mortgage interest        0          0        0
12                     Charity        0          0        0
13   Misc. repealed deductions        0          0        0
14 --------------------------- --------   -------- --------
15              Taxable income   43,400     49,000    5,600
16 --------------------------- --------   -------- --------
17       Tax on taxable income    5,558      5,499      -58
18                Child credit   -2,000     -4,000   -2,000
19      Other dependent credit        0          0        0
20               Parent credit        0          0        0
21    Earned income tax credit        0          0        0
22 --------------------------- --------   -------- --------
23                  Income tax    3,558      1,499   -2,058
24                 Payroll tax        0          0        0
25 --------------------------- --------   -------- --------
26                   Total tax    3,558      1,499   -2,058
|
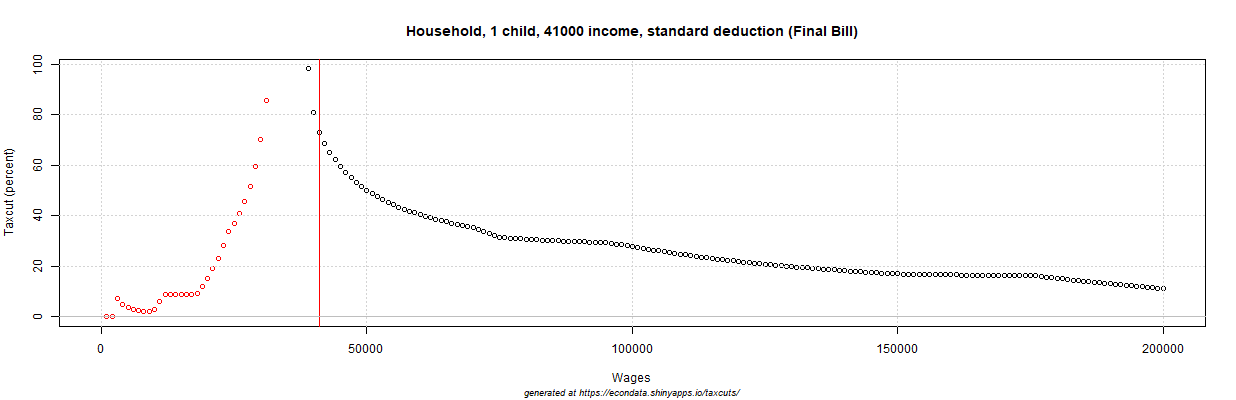
Household, 1 child, 41000 income, standard deduction

                      Tax Plan     2018 Final Bill   Change
1  --------------------------- --------   -------- --------
2  Wages, salaries, tips, etc.   41,000     41,000        0
3   Tax-deferred contributions        0          0        0
4                   Exemptions   -8,300          0    8,300
5          Standard deductions   -9,550    -18,000   -8,450
6          Itemized deductions        0          0        0
7  --------------------------- --------   -------- --------
8                      Medical        0          0        0
9        State and local taxes        0          0        0
10           Real estate taxes        0          0        0
11      Home mortgage interest        0          0        0
12                     Charity        0          0        0
13   Misc. repealed deductions        0          0        0
14 --------------------------- --------   -------- --------
15              Taxable income   23,150     23,000     -150
16 --------------------------- --------   -------- --------
17       Tax on taxable income    2,792      2,488     -304
18                Child credit   -1,000     -2,000   -1,000
19      Other dependent credit        0          0        0
20               Parent credit        0          0        0
21    Earned income tax credit        0          0        0
22 --------------------------- --------   -------- --------
23                  Income tax    1,792        488   -1,304
24                 Payroll tax        0          0        0
25 --------------------------- --------   -------- --------
26                   Total tax    1,792        488   -1,304
|
|
|
|
|
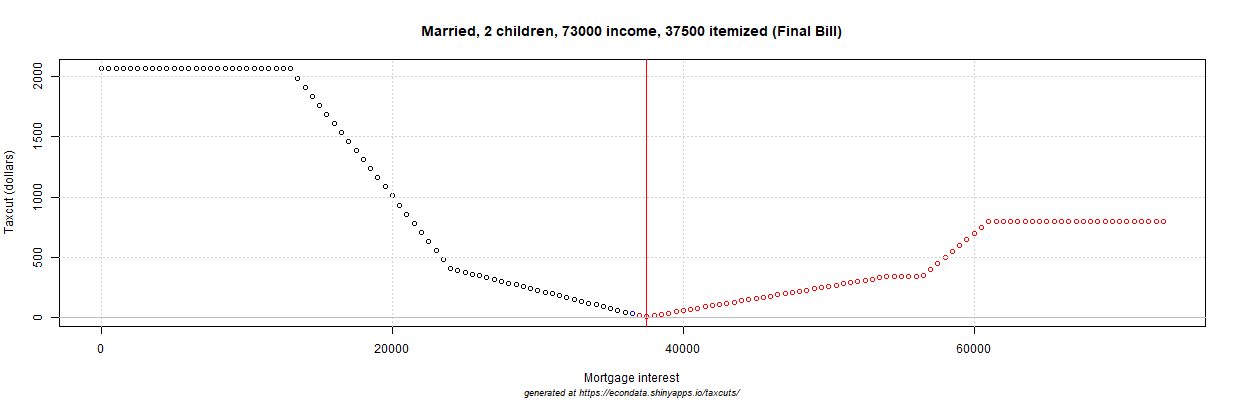
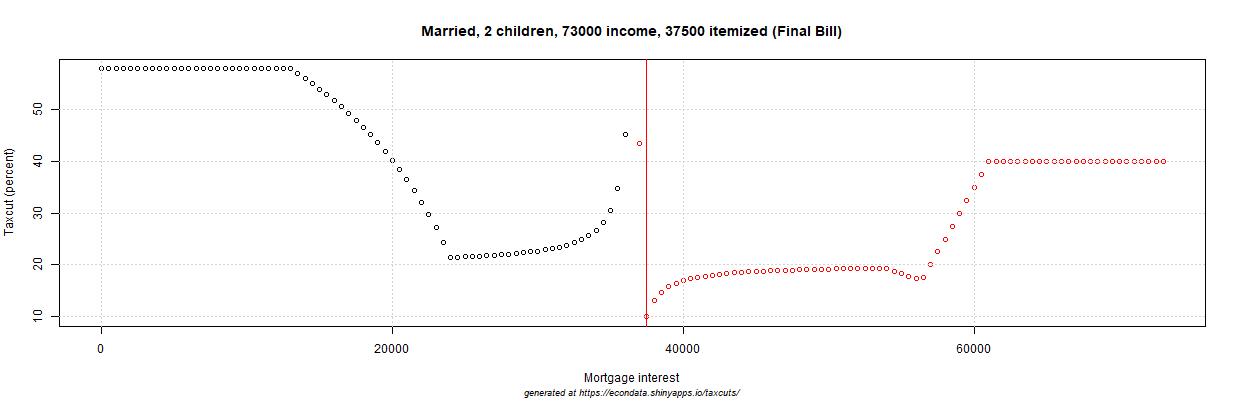
The above plots show the tax cut that will be received by taxpayers in both examples, in dollars and percentage, for all incomes up to $200,000. You can click on any of the plots above or following to see a fully expanded version of the plot. Red points indicate taxes for which the taxpayer receives a refund under both the current and new laws and black points indicate taxes for which the taxpayer pays taxes under both the current and new laws. The blue points are taxes for which the taxpayer pays taxes under the current law but receives a refund (or pays nothing) under the new law or vice-versa.
As can be seen, the incomes that were selected for the examples provided relatively large tax cuts when judged by percentage. Still, the plots show that all taxpayers with the same characteristics (married couple with 2 children and no deductions or single mother with one child and no deductions) will receive tax cuts under the final tax bill, at least up to an income of $200,000.
Family of Four, Making $73,000 a Year
A natural question is whether there are taxpayers with one or more different characteristics who don't receive tax cuts. The above plots show that varying income, at least up to $200,000, does not reveal any taxpayers who will see their taxes increase. But, as suggested by a prior post, two of the oft-mentioned benefits of the tax bill are the doubling of the standard deduction and child tax credit. What if the taxpayer has characteristics such that they don't benefit from these provisions? The first of the following two examples varies deductions from zero up to $73,000, the total wages for the first Senate example. It assume the deduction to be for home mortgage interest since this is the largest deduction for many families and it's not uncommon for families to spend 35 to 45 percent of pretax income on housing. However, any deductions can be included, as long as they are deductible under both the current and new laws.
The second of the following two examples looks at exactly the same thing as the first example except that it assumes only one child. Following is information for the two examples as generated by same interactive application:
Married, 2 children, 73000 income, 37500 itemized

         Names Taxes Released After_Tax
1 Current 2018  -110             73,110
2   Final Bill  -121             73,121
3       Change   -11    -2059        11
4     % Change   -10                  0
|
Married, 1 child, 73000 income, 37500 itemized

         Names Taxes Released After_Tax
1 Current 2018 1,505             71,495
2   Final Bill 1,879             71,121
3       Change   374    -2059      -374
4     % Change    25                 -1
|
Married, 2 children, 73000 income, 37500 itemized

                      Tax Plan     2018 Final Bill   Change
1  --------------------------- --------   -------- --------
2  Wages, salaries, tips, etc.   73,000     73,000        0
3   Tax-deferred contributions        0          0        0
4                   Exemptions  -16,600          0   16,600
5          Standard deductions        0          0        0
6          Itemized deductions  -37,500    -37,500        0
7  --------------------------- --------   -------- --------
8                      Medical        0          0        0
9        State and local taxes        0          0        0
10           Real estate taxes        0          0        0
11      Home mortgage interest  -37,500    -37,500        0
12                     Charity        0          0        0
13   Misc. repealed deductions        0          0        0
14 --------------------------- --------   -------- --------
15              Taxable income   18,900     35,500   16,600
16 --------------------------- --------   -------- --------
17       Tax on taxable income    1,890      3,879    1,989
18                Child credit   -2,000     -4,000   -2,000
19      Other dependent credit        0          0        0
20               Parent credit        0          0        0
21    Earned income tax credit        0          0        0
22 --------------------------- --------   -------- --------
23                  Income tax     -110       -121      -11
24                 Payroll tax        0          0        0
25 --------------------------- --------   -------- --------
26                   Total tax     -110       -121      -11
|
Married, 1 child, 73000 income, 37500 itemized

                      Tax Plan     2018 Final Bill   Change
1  --------------------------- --------   -------- --------
2  Wages, salaries, tips, etc.   73,000     73,000        0
3   Tax-deferred contributions        0          0        0
4                   Exemptions  -12,450          0   12,450
5          Standard deductions        0          0        0
6          Itemized deductions  -37,500    -37,500        0
7  --------------------------- --------   -------- --------
8                      Medical        0          0        0
9        State and local taxes        0          0        0
10           Real estate taxes        0          0        0
11      Home mortgage interest  -37,500    -37,500        0
12                     Charity        0          0        0
13   Misc. repealed deductions        0          0        0
14 --------------------------- --------   -------- --------
15              Taxable income   23,050     35,500   12,450
16 --------------------------- --------   -------- --------
17       Tax on taxable income    2,505      3,879    1,374
18                Child credit   -1,000     -2,000   -1,000
19      Other dependent credit        0          0        0
20               Parent credit        0          0        0
21    Earned income tax credit        0          0        0
22 --------------------------- --------   -------- --------
23                  Income tax    1,505      1,879      374
24                 Payroll tax        0          0        0
25 --------------------------- --------   -------- --------
26                   Total tax    1,505      1,879      374
|
|

|
|
|
As can be seen from the plots on the left for the first example, the tax cut received is $2,059 up to a deduction level of $13,000 but then drop sharply to $24,000 and then a bit less sharply to $37,250. This is the deduction level to which the above numbers apply. Hence, with $37,250 in mortgage interest (or some other) deduction, the family's tax cut drops to just 11 dollars. That's an $11 increase in their refund which is why the point is colored red.
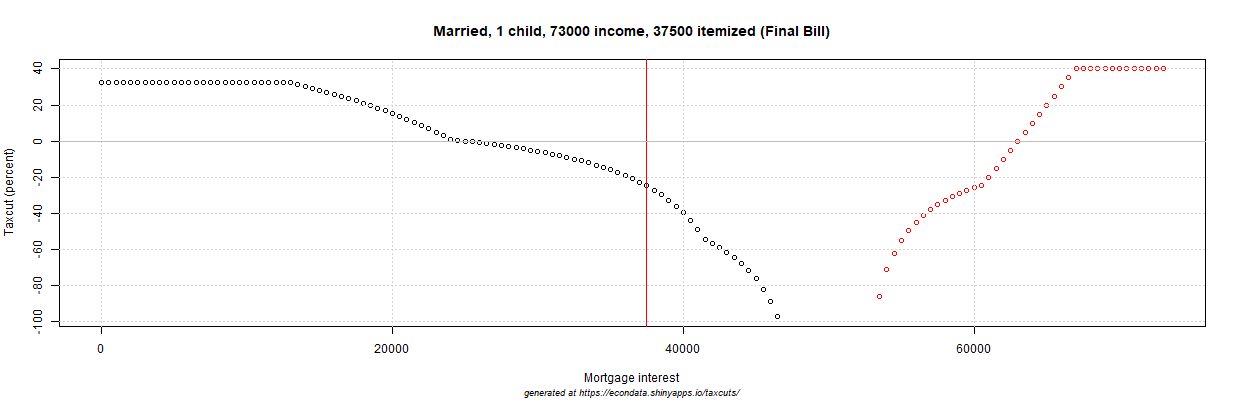
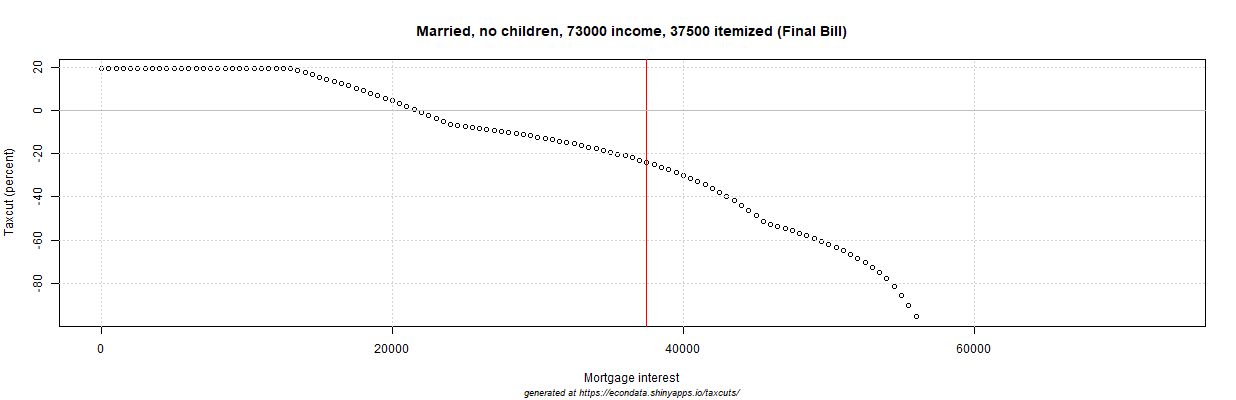
The plots on the right for the second example shows that, if the family has only one child, the tax cut is $1,681 (instead of $2,059) up to a deduction level of $13,000 but then drops sharply to just above zero (to $31) at a deduction of $24,000 and reaches a minimum of a $494 tax increase at a deduction of $41,500. That is over half of their income so the above numbers are once again for a deduction of $37,250. At that level, the tax increase is $374, nearly 25 percent.
The first of the following two examples looks at exactly the same thing as the last two examples except that it assumes that the married couple has no children. The second example likewise looks at the same thing except that it assumes that the couple has two dependents who do not qualify for the child credit, for example two children aged 17 or over, possibly in college. Following is information for the two examples as generated by same interactive application:
Married, no children, 73000 income, 37500 itemized

         Names Taxes Released After_Tax
1 Current 2018 3,128             69,872
2   Final Bill 3,879             69,121
3       Change   752    -2059      -752
4     % Change    24                 -1
|
Married, no children, 2 other dependents, 73000 income, 37500 itemized

         Names Taxes Released After_Tax
1 Current 2018 1,890             71,110
2   Final Bill 2,879             70,121
3       Change   989    -2059      -989
4     % Change    52                 -1
|
Married, no children, 73000 income, 37500 itemized

                      Tax Plan     2018 Final Bill   Change
1  --------------------------- --------   -------- --------
2  Wages, salaries, tips, etc.   73,000     73,000        0
3   Tax-deferred contributions        0          0        0
4                   Exemptions   -8,300          0    8,300
5          Standard deductions        0          0        0
6          Itemized deductions  -37,500    -37,500        0
7  --------------------------- --------   -------- --------
8                      Medical        0          0        0
9        State and local taxes        0          0        0
10           Real estate taxes        0          0        0
11      Home mortgage interest  -37,500    -37,500        0
12                     Charity        0          0        0
13   Misc. repealed deductions        0          0        0
14 --------------------------- --------   -------- --------
15              Taxable income   27,200     35,500    8,300
16 --------------------------- --------   -------- --------
17       Tax on taxable income    3,128      3,879      752
18                Child credit        0          0        0
19      Other dependent credit        0          0        0
20               Parent credit        0          0        0
21    Earned income tax credit        0          0        0
22 --------------------------- --------   -------- --------
23                  Income tax    3,128      3,879      752
24                 Payroll tax        0          0        0
25 --------------------------- --------   -------- --------
26                   Total tax    3,128      3,879      752
|
Married, no children, 2 other dependents, 73000 income, 37500 itemized

                      Tax Plan     2018 Final Bill   Change
1  --------------------------- --------   -------- --------
2  Wages, salaries, tips, etc.   73,000     73,000        0
3   Tax-deferred contributions        0          0        0
4                   Exemptions  -16,600          0   16,600
5          Standard deductions        0          0        0
6          Itemized deductions  -37,500    -37,500        0
7  --------------------------- --------   -------- --------
8                      Medical        0          0        0
9        State and local taxes        0          0        0
10           Real estate taxes        0          0        0
11      Home mortgage interest  -37,500    -37,500        0
12                     Charity        0          0        0
13   Misc. repealed deductions        0          0        0
14 --------------------------- --------   -------- --------
15              Taxable income   18,900     35,500   16,600
16 --------------------------- --------   -------- --------
17       Tax on taxable income    1,890      3,879    1,989
18                Child credit        0          0        0
19      Other dependent credit        0     -1,000   -1,000
20               Parent credit        0          0        0
21    Earned income tax credit        0          0        0
22 --------------------------- --------   -------- --------
23                  Income tax    1,890      2,879      989
24                 Payroll tax        0          0        0
25 --------------------------- --------   -------- --------
26                   Total tax    1,890      2,879      989
|
|
|
|
|
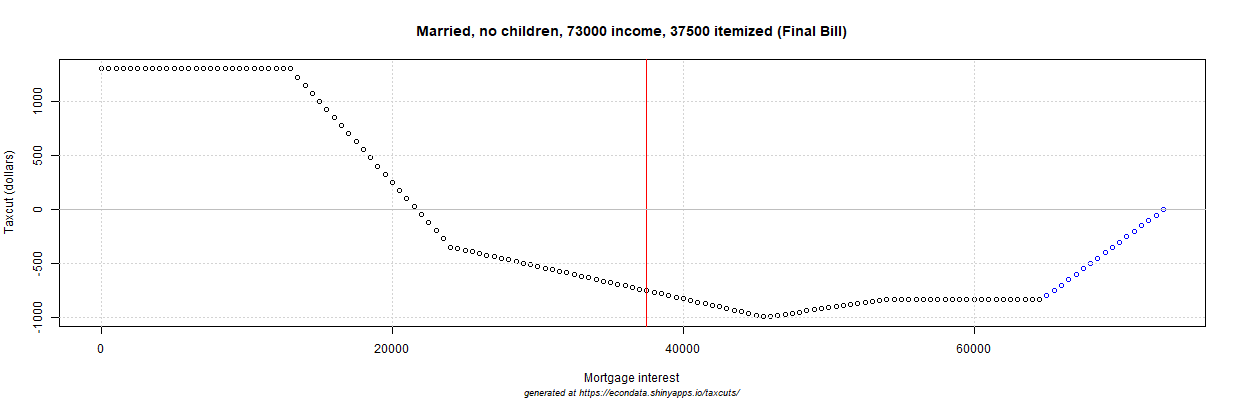
The plots on the left for the first example show that, if the family has no children, the tax cut is $1,304 (instead of $2,059) up to a deduction level of $13,000 but then drops sharply to a tax increase of $347 at a deduction of $24,000 and reaches a minimum of a $992 tax increase at a deduction of $45,500. That is over half of their income so the above numbers are once again for a deduction of $37,250. At that level, the tax increase is $752, about 24 percent.
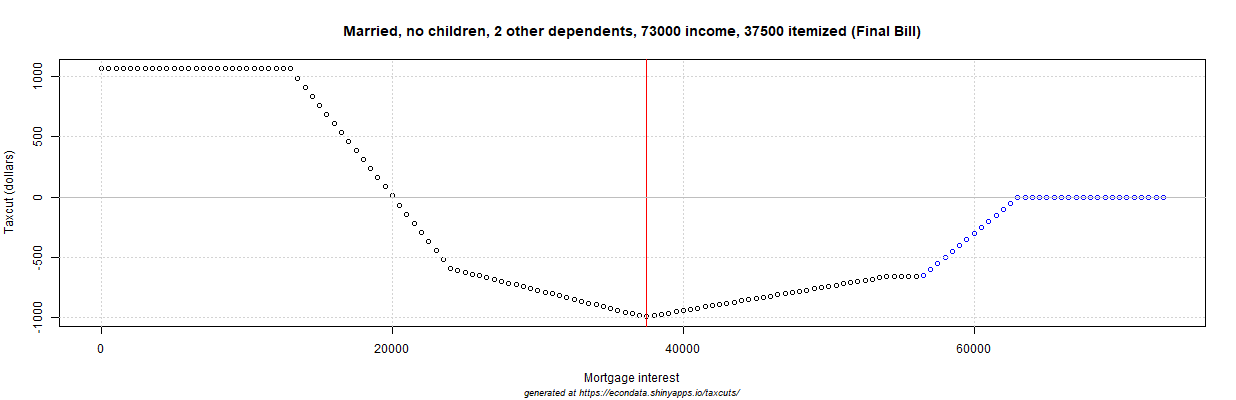
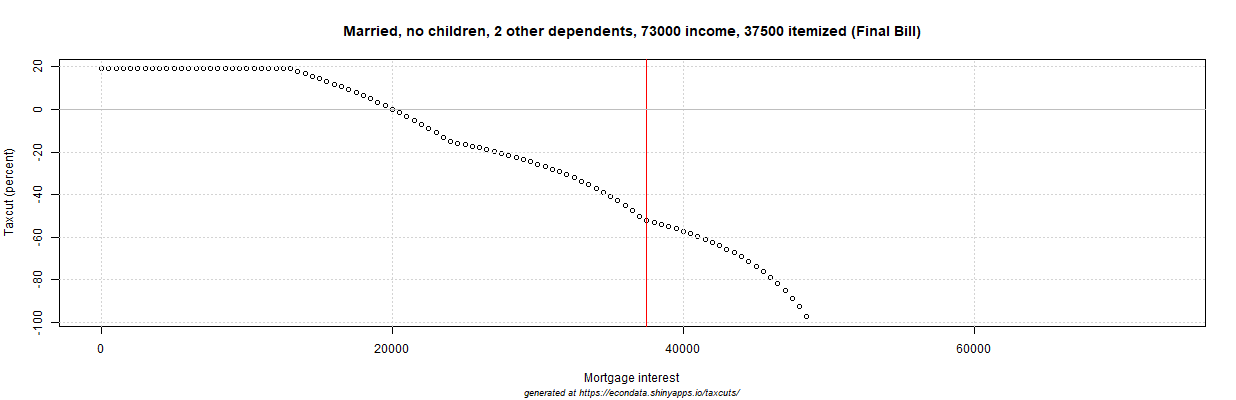
The plots on the right for the second example show that, if the family has no children but two non-child dependents, the tax cut is $1,059 (instead of $2,059) up to a deduction level of $13,000 but then drops sharply to a tax increase of $592 at a deduction of $24,000 and reaches a minimum of a $989 tax increase at a deduction of $37,500. That is a tax increase of about 52 percent and is shown in the numbers above.
One interesting thing about these two examples is that they both reach about the same minimum ($992 versus $989) even though the second example is the same as the first with two added dependents. This is because each nonchild dependent causes the elimination of a $4,150 personal exemption. Multiplying that by 12 percent (this taxpayer's top marginal rate) gives $498. This is just $2 dollars less than the $500 credit that the taxpayer receives so that credit supplies a net benefit of just about two dollars. In the same way, the $1,000 increase in the child tax credit supplies about a $502 benefit for a taxpayer whose top marginal rate is 12 percent.
Two other number to note are the $13,000 and $24,000 levels of deductions at which the plots change direction above. They are equal to the size of the standard deduction under current law and under the new law, respectively. In any event, the next section deals with the second Senate example, a single mother with one child who makes $41,000 a year.
Single Mother with One Child, Making $41,000 a Year
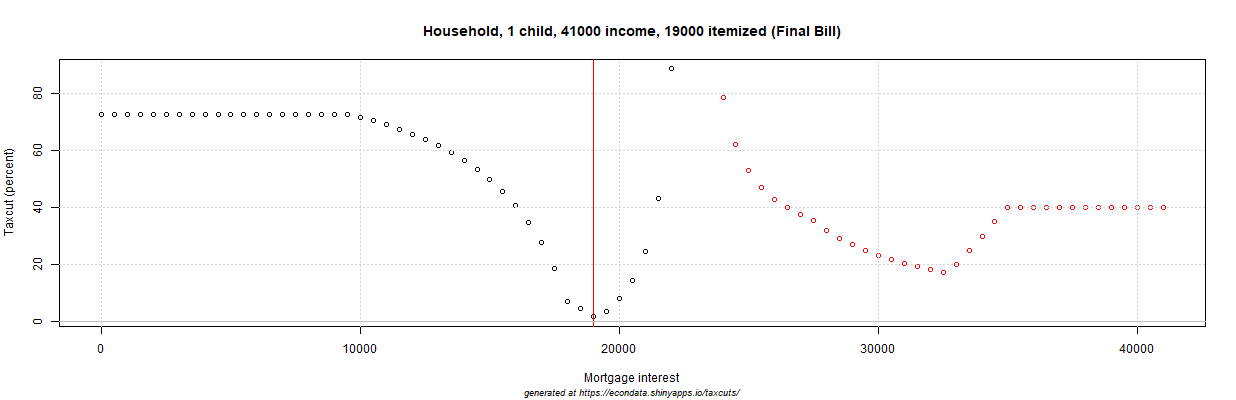
The first of the following two examples varies deductions from zero up to $41,000, the total wages for the second Senate example. As before, it assume the deduction to be for home mortgage interest but, as before, any deductions can be included, so long as they are deductible under both the current and new laws.
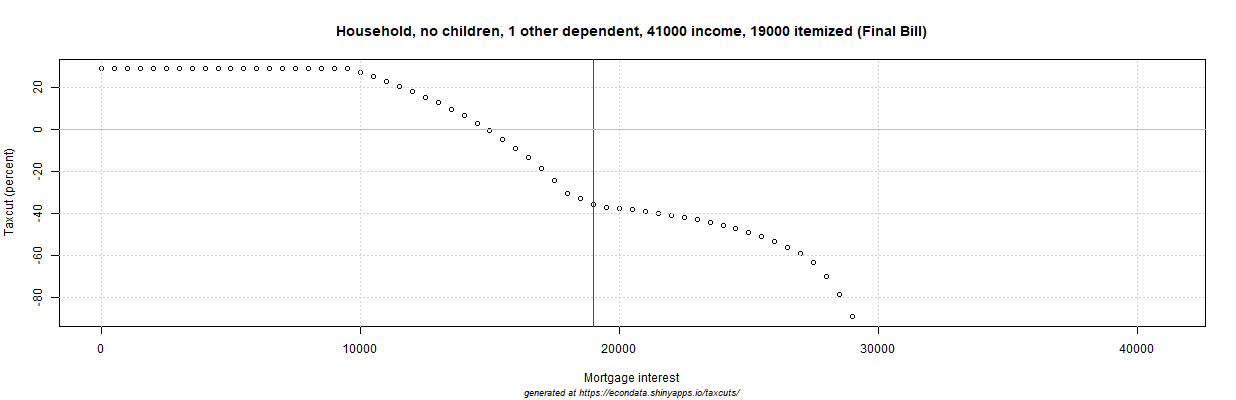
The second of the following two examples looks at exactly the same thing as the first example except that it assumes that the child is 17 or older and does not qualify for the child tax credit. Following is information for the two examples as generated by same interactive application:
Household, 1 child, 41000 income, 19000 itemized

         Names Taxes Released After_Tax
1 Current 2018   375             40,625
2   Final Bill   368             40,632
3       Change    -7                  7
4     % Change    -2                  0
|
Household, no children, 1 other dependent, 41000 income, 19000 itemized

         Names Taxes Released After_Tax
1 Current 2018 1,375             39,625
2   Final Bill 1,868             39,132
3       Change   493               -493
4     % Change    36                 -1
|
Household, 1 child, 41000 income, 19000 itemized

                      Tax Plan     2018 Final Bill   Change
1  --------------------------- --------   -------- --------
2  Wages, salaries, tips, etc.   41,000     41,000        0
3   Tax-deferred contributions        0          0        0
4                   Exemptions   -8,300          0    8,300
5          Standard deductions        0          0        0
6          Itemized deductions  -19,000    -19,000        0
7  --------------------------- --------   -------- --------
8                      Medical        0          0        0
9        State and local taxes        0          0        0
10           Real estate taxes        0          0        0
11      Home mortgage interest  -19,000    -19,000        0
12                     Charity        0          0        0
13   Misc. repealed deductions        0          0        0
14 --------------------------- --------   -------- --------
15              Taxable income   13,700     22,000    8,300
16 --------------------------- --------   -------- --------
17       Tax on taxable income    1,375      2,368      993
18                Child credit   -1,000     -2,000   -1,000
19      Other dependent credit        0          0        0
20               Parent credit        0          0        0
21    Earned income tax credit        0          0        0
22 --------------------------- --------   -------- --------
23                  Income tax      375        368       -7
24                 Payroll tax        0          0        0
25 --------------------------- --------   -------- --------
26                   Total tax      375        368       -7
|
Household, no children, 1 other dependent, 41000 income, 19000 itemized

                      Tax Plan     2018 Final Bill   Change
1  --------------------------- --------   -------- --------
2  Wages, salaries, tips, etc.   41,000     41,000        0
3   Tax-deferred contributions        0          0        0
4                   Exemptions   -8,300          0    8,300
5          Standard deductions        0          0        0
6          Itemized deductions  -19,000    -19,000        0
7  --------------------------- --------   -------- --------
8                      Medical        0          0        0
9        State and local taxes        0          0        0
10           Real estate taxes        0          0        0
11      Home mortgage interest  -19,000    -19,000        0
12                     Charity        0          0        0
13   Misc. repealed deductions        0          0        0
14 --------------------------- --------   -------- --------
15              Taxable income   13,700     22,000    8,300
16 --------------------------- --------   -------- --------
17       Tax on taxable income    1,375      2,368      993
18                Child credit        0          0        0
19      Other dependent credit        0       -500     -500
20               Parent credit        0          0        0
21    Earned income tax credit        0          0        0
22 --------------------------- --------   -------- --------
23                  Income tax    1,375      1,868      493
24                 Payroll tax        0          0        0
25 --------------------------- --------   -------- --------
26                   Total tax    1,375      1,868      493
|

|
|
|
|
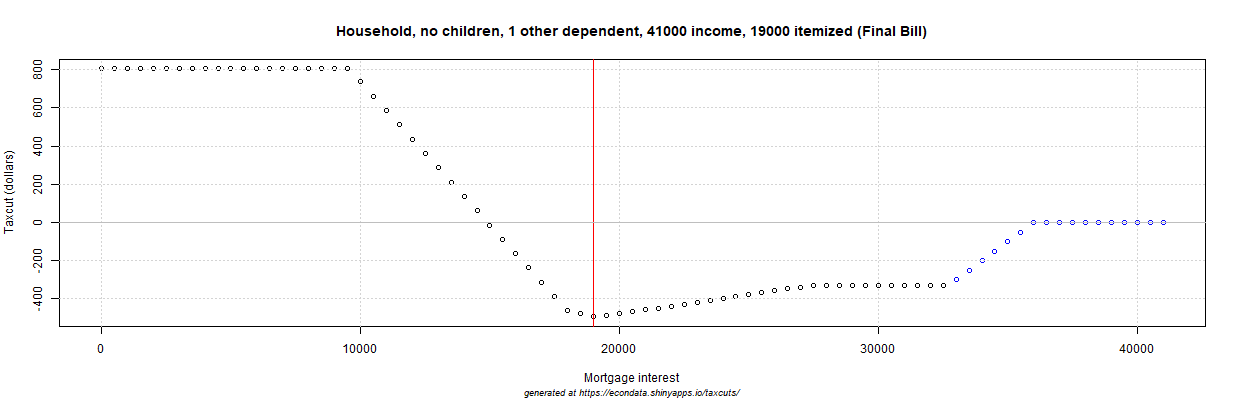
The plots on the left for the first example show that the mother with one child and income of $41,000 will receive a tax cut of $1,305 up to a deduction level of $9,500 but then drops sharply to a tax increase of just $7 at a deduction level of $19,000. That represents a tax cut of about 1.9 percent.
The plots on the right for the second example show that, if the child is 17 or older and is not eligible for the child tax credit, the mother will face a tax increase of $493, an increase of nearly 36 percent. This assumes home mortgage interest of $19,000 as before.
The change from a $7 tax cut to a $493 tax increase makes perfect sense since the difference is $500, same as the difference between the child tax credit increase of $1,000 and the dependent credit of $500. Similar to before, the numbers that mark the endpoints of the line segment that heads sharply down are $9,500 and $18,000, the size of the standard deduction under current law and under the new law for a head of household.
Summary
The above examples show that, in the case of the two examples being cited as providing large tax cuts, those tax cuts become tax increases if deductions reach about a third of wages and the children are over 17 and do not qualify for the child tax credit. To be precise, this occurs at about 28 percent (20,500/73,000) for the family of four and at about 37 percent (15,000/41,000) for the single mother. The tax increases in these cases are $989 or 53 percent and $493 or 36 percent, respectively.
A tax increase also occurs at about 35 percent (22,000/73,000) if there is just one child in the family of four (making it a family of three) and at about 30 percent (22,000/73,000) if there are no children (making it a family of two). With a deduction of $37,500, the family of three will see a tax increase of $374 or 25 percent and the family of two will see a tax increase of $752 or 24 percent.
The fact that the level of a taxpayers current deductions can turn an expected tax cut into a tax increase could cause some problems with withholding. An article in Newsday concludes as follows:
For many people, the law renders obsolete the calculations companies use to withhold taxes from their paychecks, potentially leading some workers to not set aside enough for federal taxes and face a penalty. The American Payroll Association is warning of a potential “disaster” as companies wait to update their computer systems to reflect the changes.


Comments
Post a Comment