Kevin Hassett Continues to Cherry-pick Data and Cite Uncommon Sources
So, you just heard the president say -- quote -- "It was just announced that we have the best economic numbers of any president in the history of our country."
So, let's break down the economic numbers. Growth is a modest 2.2 percent. Unemployment is relatively low, but ticking up a bit at 4.2 percent. Hiring is weak, only 29,000 jobs added at September. July and August were revised down. Inflation is at 3.4 percent. Prices rose 0.4 percent in August. Wage growth is at a five-year low, hourly wages down 0.3 percent over the past year. So, assessing it here, it's a growing economy, but hiring is slow, wages are not keeping up with rising prices. So what is the president talking about when he says it's the best economic numbers ever? Is he misinformed or is he not telling the truth?
As can be seen from the first two graphs at https://www.econdataus.com/cpi_m2.html, the Consumer Price Index for All Urban Consumers is at 3.4 percent and read GDP growth, year over year, is at 2.2 percent, just as Tapper said. As stated below the graphs, the source is the U.S. Bureau of Economic Analysis as graphed by FRED (Federal Reserve Economic Data). Hence, Tapper's quotes for these numbers are correct.
Hassett begins by calling this a "double-bind question" and goes on to mention the "buffer-stock theory of savings". He goes on to state the following regarding GDP growth:
We just had this week the consumer -- the consumer information data came out or price data came out that showed that consumption was up year over year at the highest rate in years. We have got GDP now for the third quarter running 4 to 5 percent.
This 4 to 5 percent number is far above Tapper's 2.2 percent number. In fact, Hassett is referencing a projection called GDPNow from the Federal Reserve Bank of Atlanta. Following is a graph of recent values of this measure compared to the Blue Chip consensus:
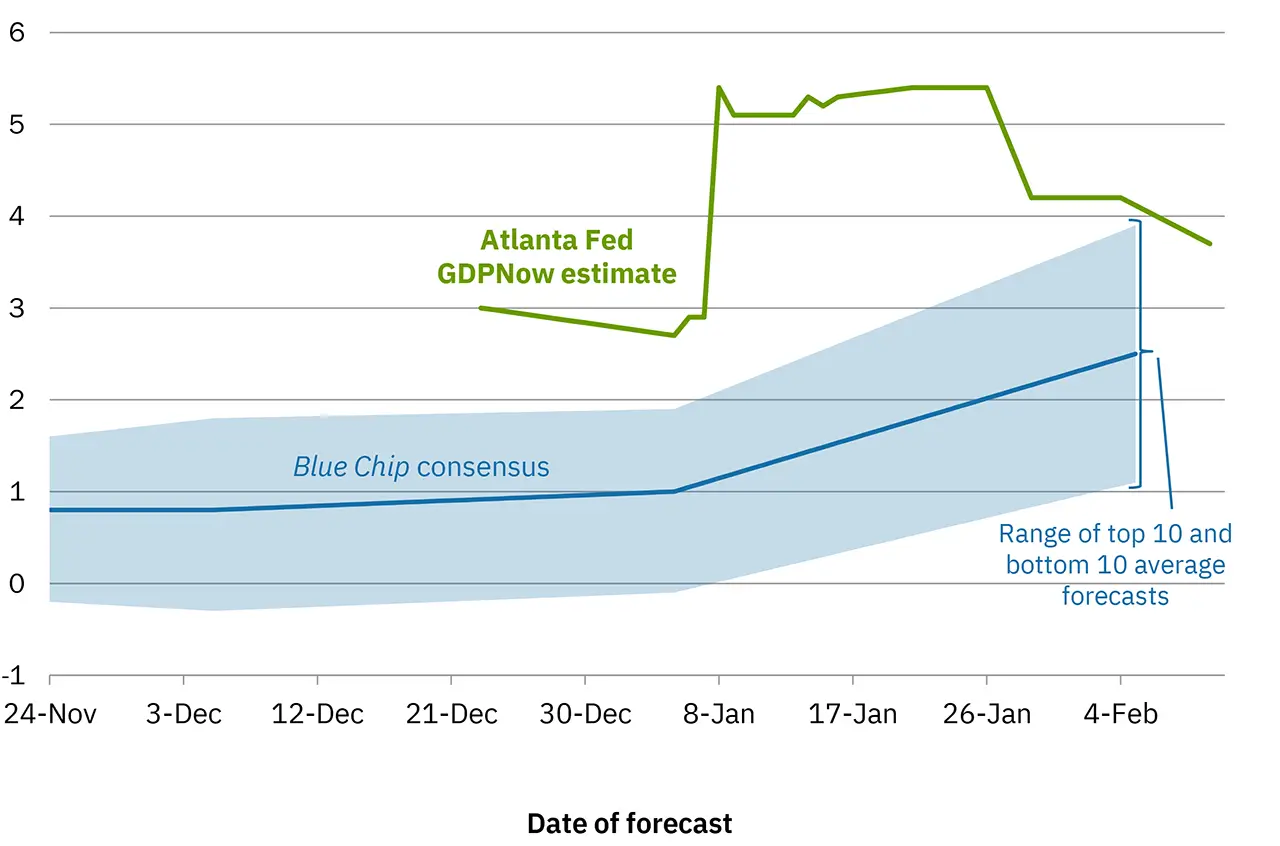
This graph comes from this link. Checking this page in the Internet Archive shows that the Third-Quarter GDPNow estimate for Q3 of 2026 has been 3.7 percent since at least September 30, 2026. It was 5.1 percent on September 25, 2026. Hence, the "4 to 5 percent" appears to rounding the 3.7% up to 4% and including the estimate from more than a week before. In addition, the graph shows that the Blue Chip consensus is much lower, closer to the current value of 2.2 percent. In addition, the second graph at this link shows that, if you ignore the huge swing during COVID, year over year GDP growth has not hit 4 percent since Q1 of 2015 and has not hit 5 percent since Q2 of 2000. This would suggest that this projection is likely just a temporary peak value if, in fact, it is reached. Nevertheless, Hassett seems to have taken to referencing the GDPNow estimate for GDP recently, likely because of the relatively high value compared to other esimates.
Shortly after the GDP reference, Hassett addresses inflation as follows:
If we look at the three-month moving average of the PCE data that came this week, then core inflation is running now at 2 percent, which is the Fed's target, and top-line inflation is at 1 percent, because food prices and gasoline prices are dropping faster than everything else.
To check Hassett's core inflation number, you can go to https://fred.stlouisfed.org/series/PCEPILFE and measure the current PCE index is 130.455 and 3 months ago was 129.796. The 3-month annualized growth over that period equals ((130.455 / 129.796)^4 - 1)*100 which equals 2.046 percent. For top-line inflation, you can go to https://fred.stlouisfed.org/series/PCEPI and measure the current PCE index is 131.579 and 3 months ago was 131.241. The 3-month annualized growth over that period equals ((131.579 / 131.241)^4 - 1)*100 which equals 1.034 percent. Hence, Hassett's numbers are correct. However, it's instructive to look at the annualized monthly changes. You can see that for core inflation via the following steps:
- Go to https://fred.stlouisfed.org/series/PCEPILFE
- Click the 'Edit Graph' button and change units to 'Compounded Annual Rate of Change'
- Click on the graph to close the Edit window
- Change on the 5Y link which should change the first date below it to 2021-08-01
This should result in the following graph:
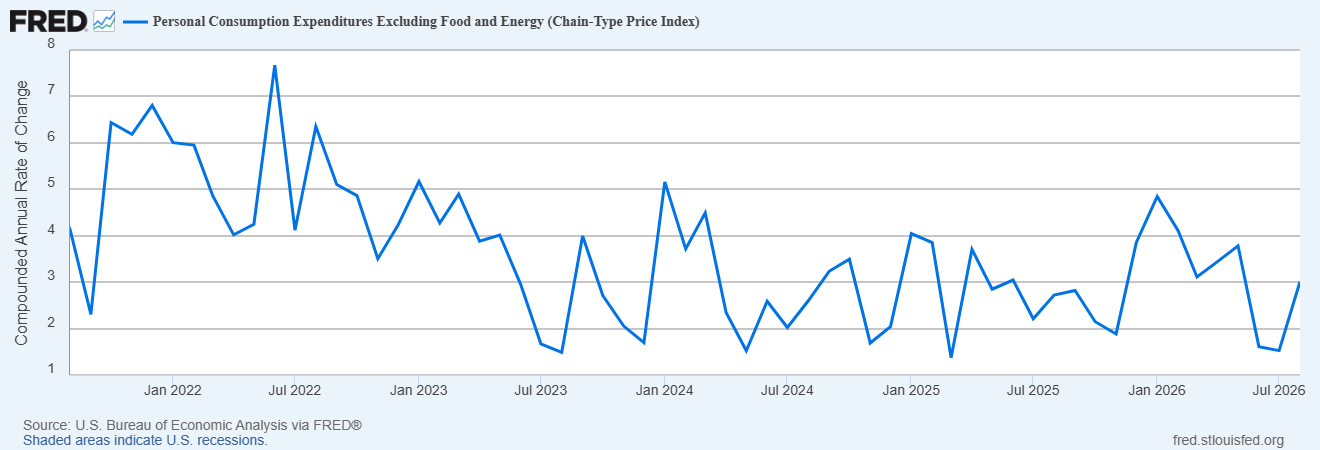
Hover the mouse over the last three points in the graph and note their values are 1.61121, 1.52476, and 3.01001. The average of these 3 values is 2.049, almost identical to the 2.046 calculated above. That's because the 3-month annualized rate is almost exactly equal to the average of the 3 monthly annualized rates. So Hassett is essentially reaching back to grab the very low rates of June and July to moderate the higher rate of August and still get a very low rate. Excellent cherry picking! If he had looked at just the last month, he would have had to report 3 percent instead of 2 percent. If he had looked at the year over year increase (which could have been done by step 2 above by selecting 'Percent Change from Year Ago'), he would have likewise gotten 3 percent. But, by looking at a 3-month average, he can look back in time and grab those 2 low increases and get the desired low number of 2 percent.
The same process applies to the top-line inflation. You can look at the annualized monthly changes for top-line inflation via the following steps:
- Go to https://fred.stlouisfed.org/series/PCEPI
- Click the 'Edit Graph' button and change units to 'Compounded Annual Rate of Change'
- Click on the graph to close the Edit window
- Change on the 5Y link which should change the first date below it to 2021-08-01
This should result in the following graph:
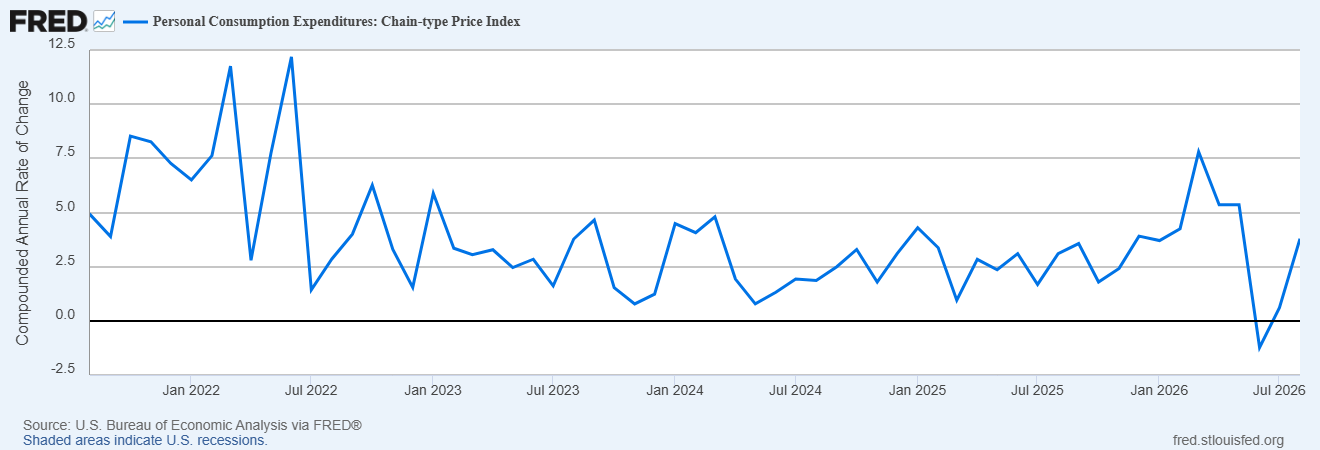
Hover the mouse over the last three points in the graph and note their values are -1.22741, 0.60577, and 3.78756. The average of these 3 values is 1.055, close to the 1.034 calculated above. That's because the 3-month annualized rate is close to the average of the 3 monthly annualized rates. So, once again, Hassett is reaching back to grab the very low rates of June and July to moderate the higher rate of August and still get a very low rate. If he had looked at just the last month, he would have had to report 3.8 percent instead of 1 percent. If he had looked at the year over year increase (which could have been done by step 2 above by selecting 'Percent Change from Year Ago'), he would have gotten 3.42 percent. But, by looking at a 3-month average, he can look back in time and grab those 2 low increases and get the desired low number of 1 percent.
It would be interesting to study if Kevin Hassett's appearances on the news shows tend to coincide with times when monthly or quarterly numbers are temporarily favorable for his arguments. In any event, he seems to be very adept at cherry-picking numbers and sources.


Comments
Post a Comment