Fact-checking the Sunday News Shows with Online Tools and AI
TAPPER: There have been job losses for six out of the 18 full months of President Trump's second term. That's a third of them. And the Trump administration has only added 548,000 net jobs so far, which is considered very slow growth. It's growth, but very slow.
Two million jobs were created in the last 18 months of Biden's presidency. Are you really arguing that your numbers are better than that?
HASSETT: Well, I disagree with your number. We will have to follow up on e-mail, but I just looked at the latest number. It was that job creation under President Trump since January 20 is about 880,000 jobs.
But we won't argue about 800 or 500 factually on a show right now. But the fact is that the thing that really jumps out at us is that those are really good jobs. They're manufacturing jobs. They're construction jobs. The number of manufacturing jobs under Joe Biden dropped by 230,000.
It's possible to quickly check whose numbers are correct on the BLS (Bureau of Labor Statistics) web site via the following steps:
- Go to https://www.bls.gov/
- Click on 'DATA TOOLS' in the top blue menu and then select 'Top Picks, One Screen, Multi-Screen, and Maps'.
- In the Employment section, select the first 'TOP PICKS' icon (for Employment, Hours, and Earnings - National). This will go to https://data.bls.gov/toppicks?survey=ce.
- Check the second checkbox labelled "Total Nonfarm Employment, Seasonally Adjusted - CES0000000001".
- Press the blue 'Retrieve data' button.
- Click on "More Formatting Options".
- Check the checkbox labelled "Include graphs" in the Graphs section and press the 'Retrieve Data' button.
This should result in the following graph and table:
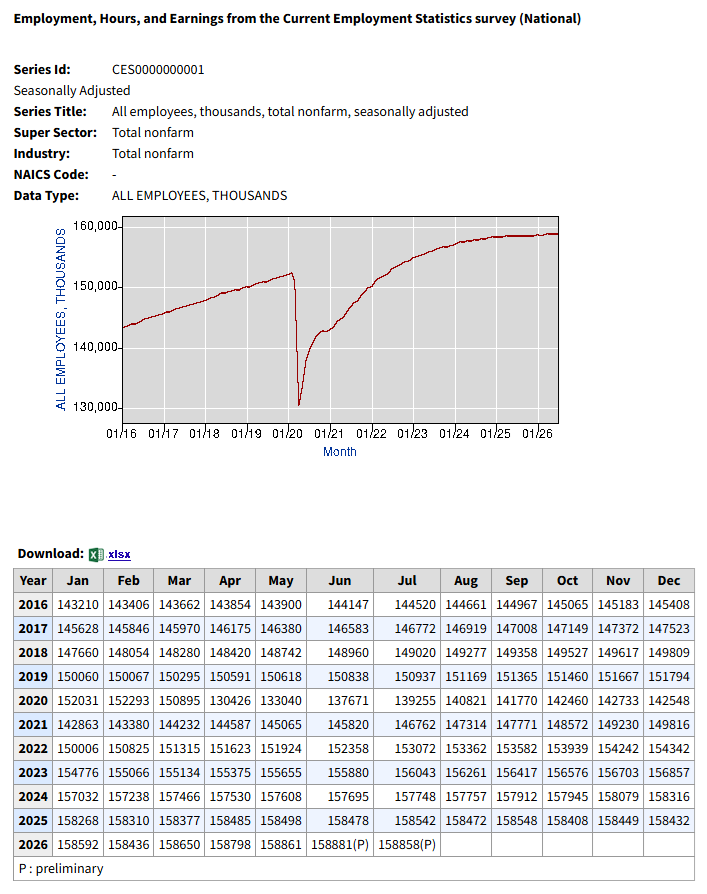
As can be seen, job growth under Trump has been 158,858 thousand (July 2026) minus 158,310 thousand (February 2025) which equals 548 thousand, the number that Jake quoted. The answer to the first question of "What is the CES survey?" on this BLS page states that the "reference period for the CES survey is the pay period which includes the 12th of the month." Hence, an argument could be made for counting from January 2025 for which that week is very close to January 20, the date referenced by Hassett. In that case, the number would be 158,858 thousand (July 2026) minus 158,268 thousand (January 2025) which equals 590 thousand. Both numbers are far short of Hassett's 880 thousand number. In fact, 158,858 thousand (July 2026) minus 880 thousand equals 157,978 thousand, a number that Biden passed in November of 2024.
Regarding Hassett's statement that the "number of manufacturing jobs under Joe Biden dropped by 230,000", that can be checked on the BLS (Bureau of Labor Statistics) web site via the following steps:
- Go to https://www.bls.gov/
- Click on 'DATA TOOLS' in the top blue menu and then select 'Top Picks, One Screen, Multi-Screen, and Maps'.
- In the Employment section, select the first 'TOP PICKS' icon (for Employment, Hours, and Earnings - National). This will go to https://data.bls.gov/toppicks?survey=ce.
- Check the third checkbox labelled "Manufacturing Employment, Seasonally Adjusted - CES3000000001".
- Press the blue 'Retrieve data' button.
- Click on "More Formatting Options".
- Check the checkbox labelled "Include graphs" in the Graphs section and press the 'Retrieve Data' button.
This should result in the following graph and table:
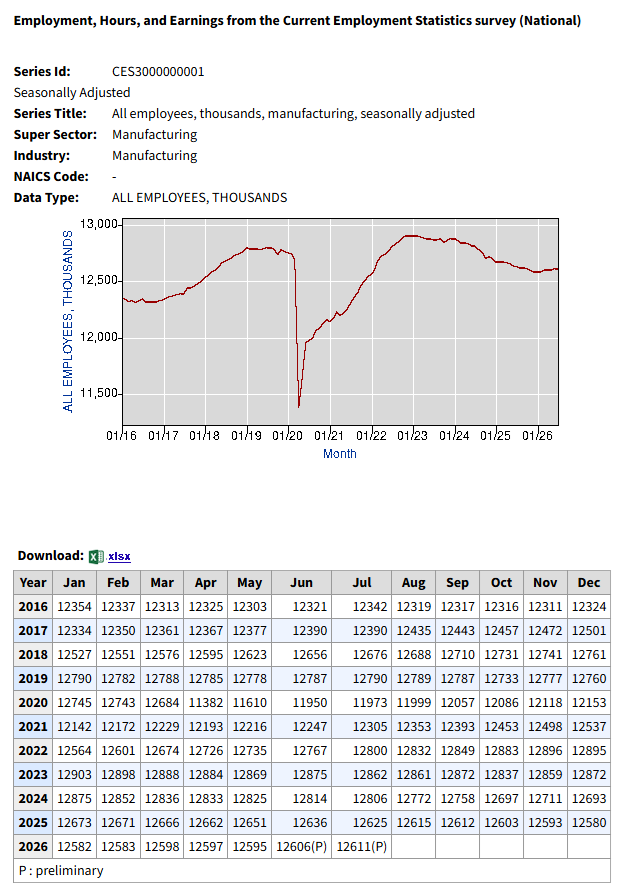
As can be seen, the number of manufacturing jobs under Biden went from 12,142 thousand in January of 2021 to 12,673 thousand in january of 2025. That's an increase of 531 thousand manufacturing job. Of course, some of that was due to the recovery from COVID and manufacturing jobs did go down from there to 12,673 thousand in January of 2025. That's a drop of 230 thousand manufacturing jobs in 24 months. However, the number of manufacturing jobs continued down under Trump, going from 12,673 thousand in January of 2025 to 12,580 thousand in December of 2025, a drop of 93 thousand before recovering 31 thousand since then. Hence, Hassett was referring to the drop in manufacturing from the high in the middle of Biden's term, ignoring the rise of 113 thousand from the pre-COVID high to that time (January of 2023).
In any case, following is an excerpt from further on in the interview:
TAPPER: Yes, it's 800,000, according to you, versus two million under Biden.
And I think the issue is that there are two things right now that the economists say are weighing on the economy. Both of them are specifically Trump policies. One is obviously the Iran war, which has led to high gas prices. The president said that that war would take four to six weeks. We're now in month six.
And the second policy that's having an impact is tariffs, which, according to a recent report by the Fed, those tariffs were passed on to customers, consumers, in the form of higher prices. So it does seem as though the president's policies have led to this economic situation where the job growth is slower than in the last 18 months of Biden's administration.
HASSETT: Well, let's unpack these things.
First of all, if you look at the latest inflation numbers, right, the Consumer Price Index was negative for the month of June. Core was zero. That's the thing that the Fed cares about. The PCE index, which is the Fed's number one index, was negative both for core and top line.
And so all of the price data have been decelerating. Now, there was a big inflation in the previous administration, but there's been rapid deceleration of inflation under President Trump. And so, if you're going to tell a story that tariffs are causing some kind of positive shock to inflation, then you got to come up with some counterfactual that explains why it is that right now inflation is running at about zero.
At first, Kevin Hassett's claim that "the Consumer Price Index was negative for the month of June" seems to very much contradict recent reporting of the CPI. The trick is that Hassett is referring to the CPI of a single month whereas most reporting looks at the percent change from a year ago. At the time of the interview, that number was about 3.5 percent. The measurement that Hassett is referring to can be added to the fourth graph in this section:
- Click the "Edit Graph" button.
- Click the 'ADD LINE' tab.
- Under "Add data series to graph", enter CPIAUCNS and select "Consumer Price Index for All Urban Consumers: All Itmes in U.S. City Average".
- Click the "Add data series" button.
- Change Units to "Compounded Annual Rate of Change" and ensure that "Modify frequency" is "Monthly".
- Change the first date above the graph from "1913-02-01" to "2000-01-01".
- Click the "Edit Graph" button.
- Click the FORMAT tab.
- Click 'Customize' in the box in the 'Line 3' section and change the 'Line style' to Solid, the first 'Width' to 1, and Color to orange (#f4a261).
- Also, set 'Mark type' to Circle and the second 'Width' to 3.
- Click on graph to close Edit Graph panel.
- Optionally, you can click on the "Download" button to download the data to a CSV or Excel file or download the graph to a PNG file or Powerpoint file.
- Hover the mouse over the far right at June 2026 to show that the value to which Hassett is referring.
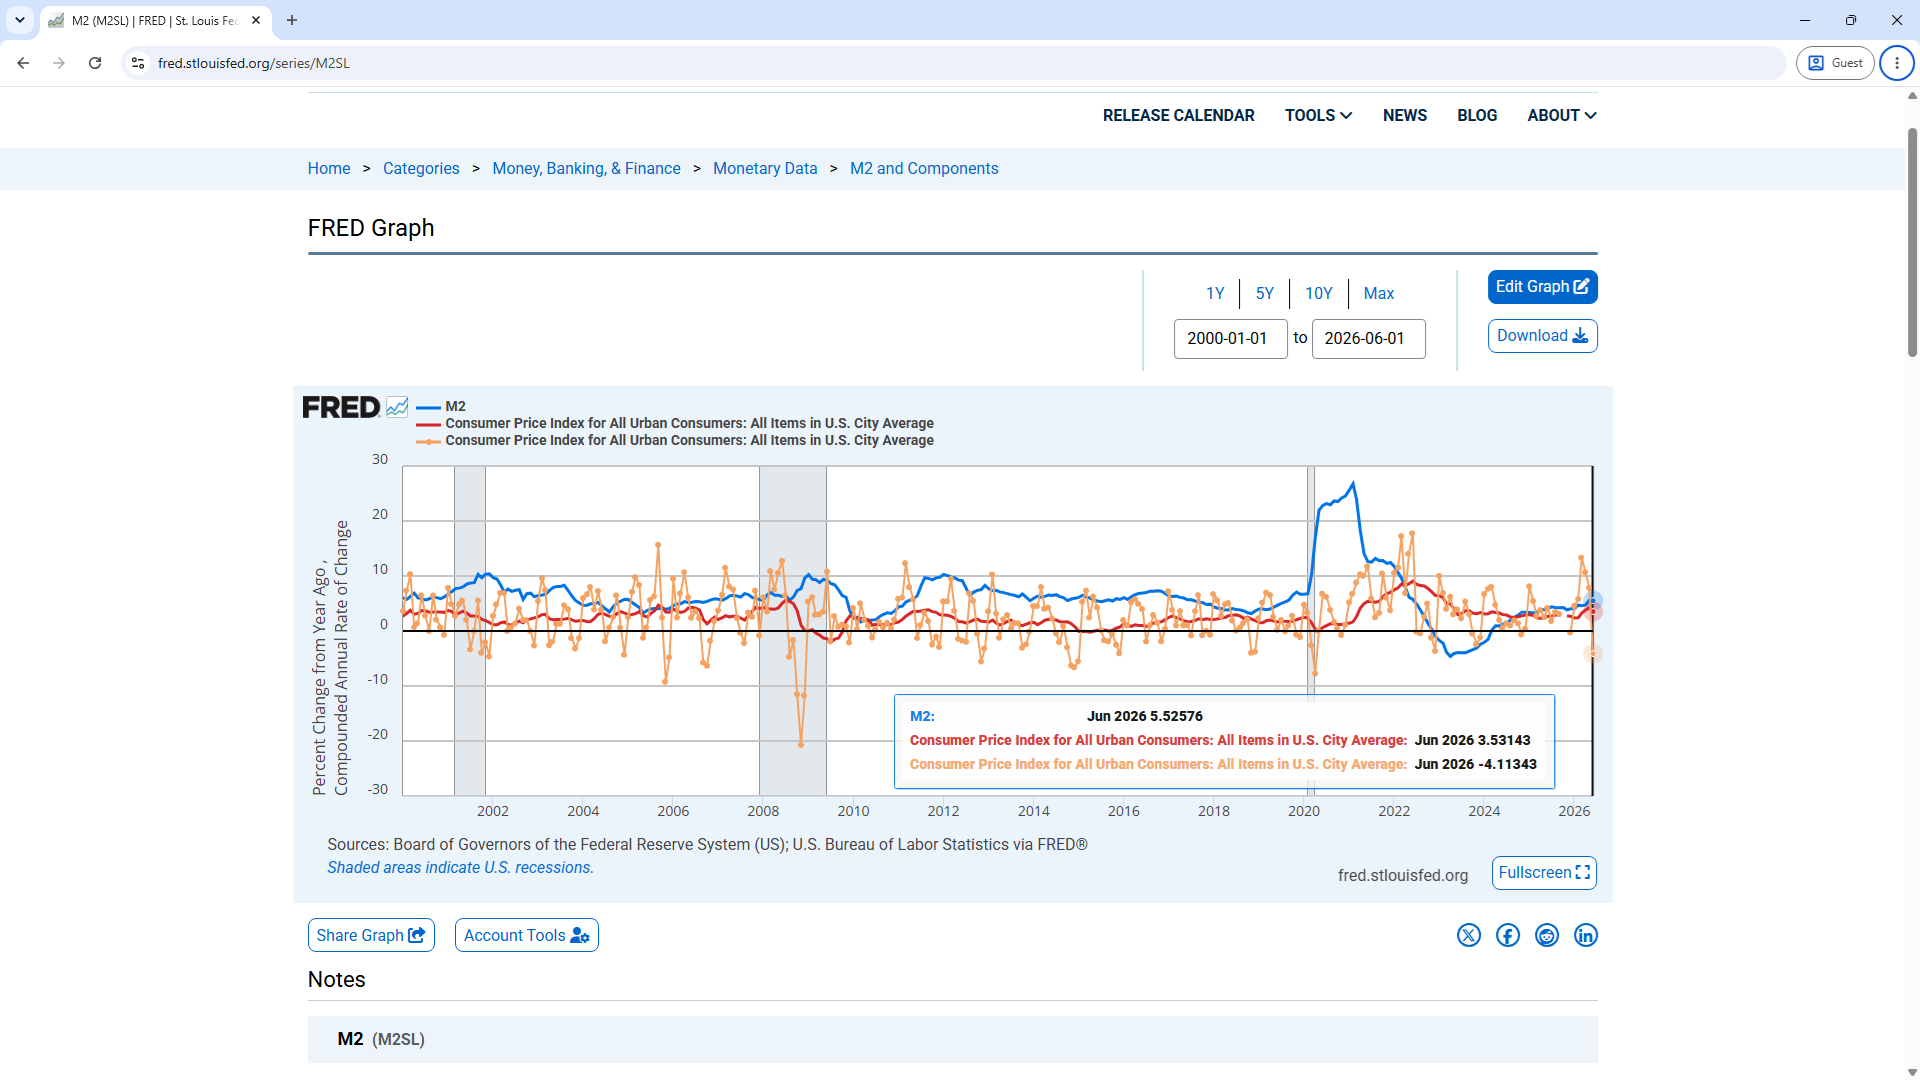
A larger copy of the above graph can be found at this link. Note the 3 orange dots preceding the orange dot showing -4.1 percent for June 2026. Those dots show compounded annual rates of change of about 13.3, 10.7, and 7.8 percent for March, April, and May of 2026. Of course, Hassett doesn't mention this since it would show the misleading nature of his argument that "right now inflation is running at about zero".
Also, note in the graphs above how the the annual growth in the M2 money supply was already very high in January of 2021, the last month of Trump's first term as President. The annual growth reached its peak just a month later, in February of 2021. This growth in M2 likely had much to do with the growth in inflation which peaked in June of 2022 at about 9 percent, just 5 months after Trump left office. Hence, it seems misleading to blame the inflation only on Biden when many of the conditions that led to it were likely already in place when he took office.
These and other problems with Hassett's statement were found by asking the following question of Gemini and ChatGPT:
Evaluate the accuracy of Kevin Hassett's comments at https://transcripts.cnn.com/show/sotu/date/2026-08-09/segment/01. Provide the evaluation in HTML.
Gemini's response is at https://econdataus.com/ai/hassett_260809_gemini.htm and ChatGPT's response is at https://econdataus.com/ai/hassett_260809_chatgpt.htm.


This comment has been removed by a blog administrator.
ReplyDelete