Analyzing the Monthly Treasury Statement with Online Tools and Shiny
Analyzing the Federal Debt with Online Tools and Shiny
On March 13, 2026, Yahoo Finance posted an article from Fortune Magazine titled "The national debt isn't $39 trillion. One economist says it's actually $100 trillion". The article begins:
The U.S. national debt is nearly $39 trillion. One of the country's top fiscal economists says the real number is closer to $100 trillion - and that Washington's own accounting rules are designed to hide it.
The $39 trillion figure can be verified on the Federal Reserve Economic Data (FRED) website at https://fred.stlouisfed.org/series/GFDEBTN. On March 14, it displayed the following graph:
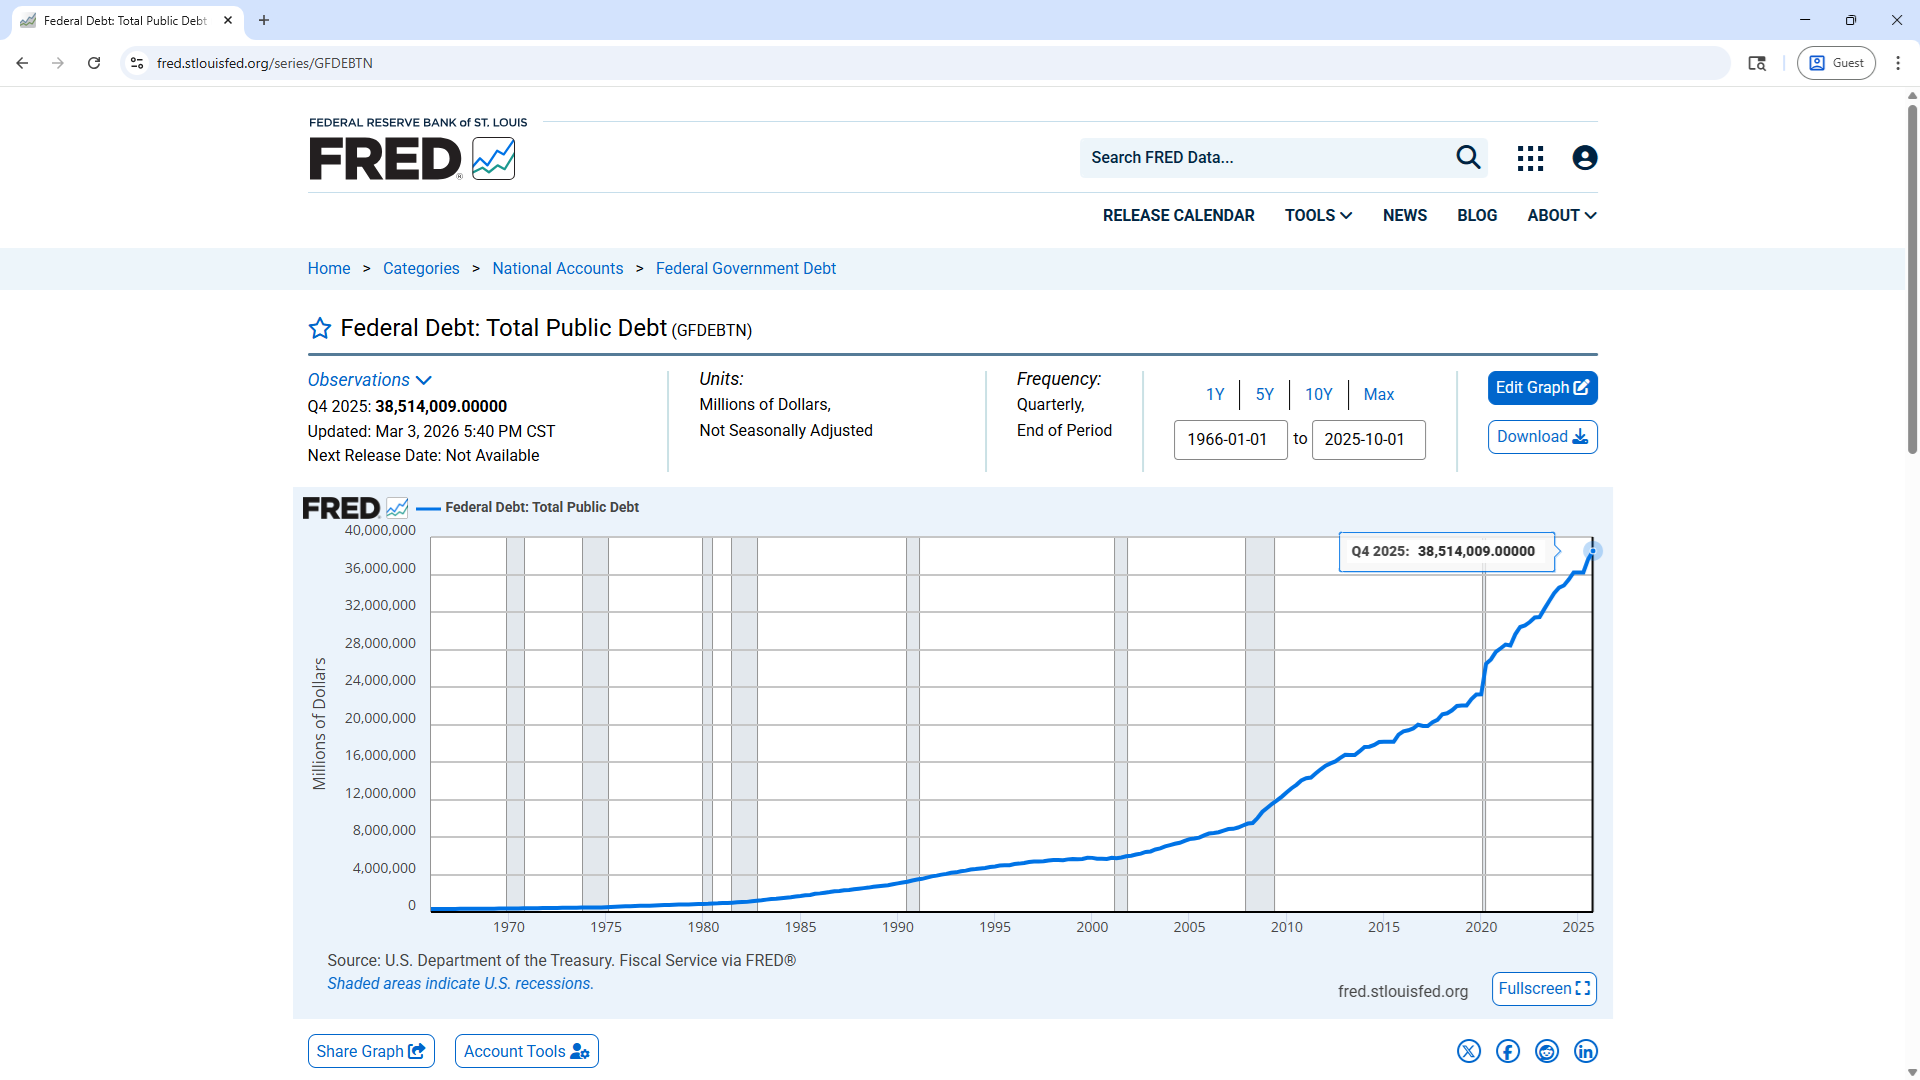
As cam be seem. the federal debt is nearly $39 trillion dollars. Further on, the article states:
If the U.S. government were required to report its finances under the same accounting rules as a publicly traded corporation, Smetters pointed out, the debt-to-GDP ratio wouldn't be the current level of 100%, which is bad enough. "We'd be reporting a debt-to-GDP ratio closer to 300%." The gap between those two numbers, he warned, is not a rounding error - it is the deliberate product of federal accounting standards designed to keep the full picture hidden from the public.
Actually, the author seems to be making an error in stating that saying that the current debt-to-GDP ratio is 100%. The following FRED graph at https://fred.stlouisfed.org/series/GDP/ shows the current value of the GDP to be $31.442483 trillion:
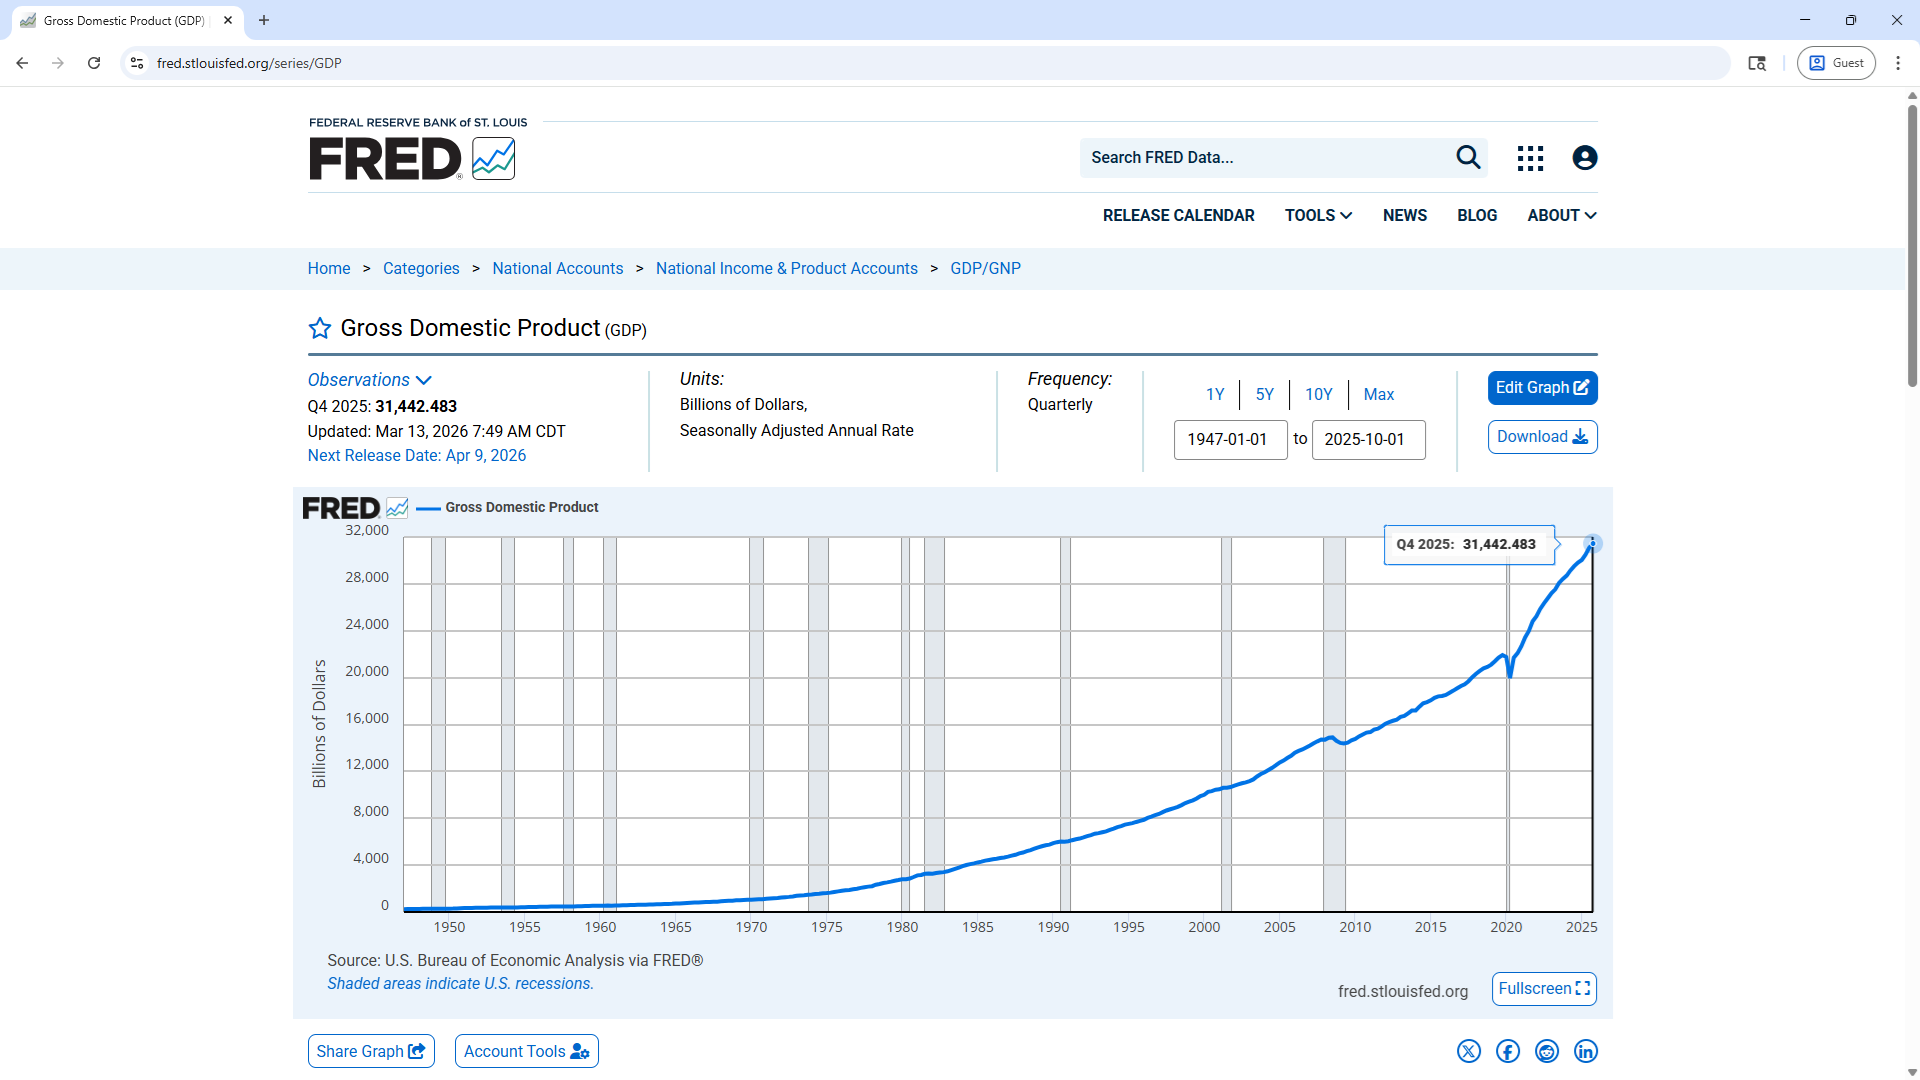
The federal debt of $38.514 trillion is 122.49 percent of $31.442 trillion, not 100 percent. This can be seen in the following FRED graph from https://fred.stlouisfed.org/series/GFDEGDQ188S.

The 100% of GDP figure likely comes from a confusion of two measures of the federal debt. Table 6 of the latest Monthly Treasury Statement lists "Debt Held by the Public" as $31,186,964 million and "Total Treasury Securities Outstanding" as $38,769,806 million. The difference is "Intragovernmental Holdings" of $7,582,841 million. The values of all 3 of these debt measures can be via the R Shiny app at https://econdata.shinyapps.io/mts1/. The steps to display a plot of these values are as follows:
- Go to https://econdata.shinyapps.io/mts1/
- Set 'Topic' in the left sidepanel to "Debt".
- Ensure that 'Units' is set to "Actual Dollars".
- Hover the mouse over the rightmost point in the green line.

Changing 'Units' to "Percent of GDP" to display the following plot:

As can be seen, the Public Debt (or Debt Held by the Public) is just below 100 percent. The blue line shows the "Intergovernmental Holdings". These holdings are described on Wikipedia as "debt obligations that a government owes to its own agencies" which, in the United States are "primarily composed of the Medicare trust funds, the Social Security Trust Fund, and Federal Financing Bank securities."
Analyzing the Trust Funds with Shiny
Changing 'Topic' to "Trust Funds" and changing 'Units' back to "Actual Dollars" should display the following:

As can be seen, the Old-Age and Survivors Insurance (OASI) Trust Fund (orange line) and Military Retirement Trust Fund (purple line) both have a bit over $2 trillion (about $2.308 trillion and $2.083 trillion, respectively). The Federal Employment Retirement Trust Fund (green line) has a bit over $1 trillion (about $1.128 trillion). The full Social Security Trust Fund consists of the Old-Age and Survivors Insurance (OASI) Trust Fund and the Disability Insurance Fund (red line) and the full Medicare Trust Fund consists of the Hospital Insurance Fund and the Supplemental Insurance Fund (cyan line).
Changing 'Units' to "Percent of GDP" to display the following plot:

Looking at the trust funds as a percent of GDP shows that the Old-Age and Survivors Insurance (OASI) Trust Fund (orange line) appears to have been declining at a fairly constant rate until 2021 and has been declining at a slightly larger constant rate since then. Clicking on the 'Text' tab should display the following data since 2021:
date disability_insurance fed_emp_retirement hospital_insurance old_age_survivors_ins supplemental_insurance military_retirement other_trust_funds cpi gdp
71 2021-01-31 0.4580358 4.593780 NA 13.184492 0.6516136 4.704209 NA 261.582 21349.62
72 2021-02-28 0.4535446 4.572279 NA 13.097455 0.8083394 4.710372 NA 263.014 21362.45
73 2021-03-31 0.4538321 4.546836 NA 13.026600 0.8303103 4.703938 NA 264.877 21396.82
74 2021-04-30 0.4654968 4.518864 NA 13.055145 0.7164996 4.687467 NA 267.054 21452.74
75 2021-05-31 0.4633100 4.484096 NA 12.948881 0.8388042 4.709497 NA 269.195 21530.19
76 2021-06-30 0.4509430 4.492623 NA 12.851316 0.8198373 4.694000 NA 271.696 21678.15
77 2021-07-31 0.4449079 4.428974 NA 12.691463 0.6829802 4.643062 NA 273.003 21896.61
78 2021-08-31 0.4375252 4.307450 NA 12.454456 0.7820285 4.646670 NA 273.567 22185.58
79 2021-09-30 0.4368347 4.223497 NA 12.279858 0.7605424 4.598622 NA 274.310 22441.50
80 2021-10-31 0.4290049 4.117455 NA 12.117650 0.7552861 5.040950 NA 276.589 22664.38
81 2021-11-30 0.4249771 4.083167 NA 11.943961 0.7313615 5.002342 NA 277.948 22854.21
82 2021-12-31 0.4312788 4.380259 NA 11.938885 0.7883837 4.956183 NA 278.802 23056.49
83 2022-01-31 0.4392147 4.321014 NA 11.865159 0.7560827 4.945086 NA 281.148 23271.24
84 2022-02-28 0.4345018 4.261769 NA 11.670182 0.7744925 4.914332 NA 283.716 23498.44
85 2022-03-31 0.4348044 4.204287 NA 11.509327 0.8042476 4.886534 NA 287.504 23721.29
86 2022-04-30 0.4485074 4.151984 NA 11.472982 0.6861343 4.852628 NA 289.109 23939.78
87 2022-05-31 0.4460070 4.102202 NA 11.304613 0.8285649 4.878241 NA 292.296 24153.92
88 2022-06-30 0.4613925 4.097347 NA 11.321972 0.8220010 4.844105 NA 296.311 24364.33
89 2022-07-31 0.4576758 4.044925 NA 11.188351 0.7882762 4.835416 NA 296.276 24571.01
90 2022-08-31 0.4564162 3.995309 NA 11.032248 0.8017778 4.857632 NA 296.171 24773.96
91 2022-09-30 0.4591808 4.140874 NA 10.905464 0.6725397 4.783461 NA 296.808 24974.64
92 2022-10-31 0.4537770 4.093283 NA 10.768989 0.8121029 5.405533 NA 298.012 25173.06
93 2022-11-30 0.4513644 4.046417 NA 10.607734 0.7882758 5.364666 NA 297.711 25369.23
94 2022-12-31 0.4618844 4.049123 NA 10.612353 0.8296724 5.303926 NA 296.797 25554.36
95 2023-01-31 0.4723508 3.842836 0.7976329 10.568500 0.8072709 5.280905 1.3102179 299.170 25728.46
96 2023-02-28 0.4732721 3.818393 0.7656543 10.428175 0.8014602 5.241423 1.3210724 300.840 25891.54
97 2023-03-31 0.4792612 3.794674 0.6812753 10.319765 0.6795042 5.201531 1.3042989 301.836 26054.87
98 2023-04-30 0.4936913 3.770791 0.8118405 10.305767 0.7978666 5.213650 1.3044222 303.363 26218.46
99 2023-05-31 0.4953478 3.747105 0.7909285 10.165540 0.7860859 5.187112 1.3569181 304.127 26382.30
100 2023-06-30 0.5299922 3.850582 0.7361862 10.282985 0.6176741 5.138160 1.3368196 305.109 26537.88
101 2023-07-31 0.5286998 3.816513 0.7709068 10.177003 0.7331675 5.137074 1.3121231 305.691 26685.20
102 2023-08-31 0.5276288 3.775862 0.7461101 10.034197 0.7211911 5.129442 1.3048219 307.026 26824.27
103 2023-09-30 0.5299620 3.929856 0.7207849 9.915531 0.5916396 5.068910 1.2812252 307.789 26965.27
104 2023-10-31 0.5254896 3.895158 0.7511757 9.791168 0.7059852 5.874921 1.2681931 307.671 27108.21
105 2023-11-30 0.5243166 3.859983 0.7307539 9.641926 0.6694912 5.845104 1.2655940 307.051 27253.09
106 2023-12-31 0.5361879 3.872587 0.7612762 9.641642 0.6843091 5.773578 1.2451973 306.746 27395.62
107 2024-01-31 0.5500146 3.835502 0.7732212 9.621307 0.6758853 5.749821 1.2323159 308.417 27535.82
108 2024-02-29 0.5533975 3.801068 0.7409869 9.490274 0.6711032 5.726413 1.2384088 310.326 27673.67
109 2024-03-31 0.5603871 3.772173 0.7492632 9.391386 0.6661912 5.703515 1.2281068 312.332 27807.00
110 2024-04-30 0.5796481 3.741883 0.8356788 9.412454 0.6713640 5.704079 1.2223279 313.548 27935.83
111 2024-05-31 0.5834980 3.715164 0.7350020 9.294332 0.5109325 5.673968 1.2799720 314.069 28060.14
112 2024-06-30 0.6154082 3.731823 0.8570216 9.374657 0.6337875 5.671207 1.2624900 314.175 28187.93
113 2024-07-31 0.6151730 3.698284 0.8110754 9.273292 0.5953471 5.644704 1.2279484 314.540 28319.20
114 2024-08-31 0.6156570 3.670948 0.7316095 9.138713 0.4703896 5.606632 1.2222572 314.796 28453.94
115 2024-09-30 0.6219441 3.834747 0.8220058 9.033841 0.5751959 5.594593 1.1726379 315.301 28583.69
116 2024-10-31 0.6195469 3.804077 0.8010183 8.921925 0.5764149 6.252086 1.1364364 315.664 28708.43
117 2024-11-30 0.6198908 3.774619 0.7422561 8.786587 0.4535275 6.198674 1.1368514 315.493 28828.16
118 2024-12-31 0.6325613 3.796673 0.8186213 8.768465 0.5853155 6.161679 1.1282759 315.605 28946.89
119 2025-01-31 0.6473171 3.703284 0.7922451 8.751512 0.4576564 6.127409 1.1118098 317.671 29064.60
120 2025-02-28 0.6508068 3.688384 0.7680100 8.628558 0.4737486 6.116531 1.1165143 319.082 29181.31
121 2025-03-31 0.6585771 3.578998 0.8061272 8.484199 0.6019260 6.127444 1.0961452 319.799 29296.17
122 2025-04-30 0.6778885 3.565727 0.8785015 8.485952 0.6044833 6.121213 1.1101670 320.795 29409.18
123 2025-05-31 0.6810719 3.551521 0.7823958 8.354538 0.4438842 6.075324 1.1388910 321.465 29520.34
124 2025-06-30 0.7123367 3.072998 0.9062740 8.390033 0.6047600 6.073556 1.1451732 322.561 29631.63
125 2025-07-31 0.7144232 3.648903 0.8651646 8.291606 0.5648649 6.047881 1.1133087 323.048 29743.06
126 2025-08-31 0.7158387 3.624865 0.7830491 8.149024 0.4189114 6.035877 1.1047207 323.976 29854.61
127 2025-09-30 0.7184849 3.773328 0.8437794 8.009888 0.5132740 6.028479 1.0475413 324.800 29973.05
128 2025-10-31 0.7171595 3.743290 0.7135603 7.882171 0.2070161 6.717770 1.0254667 NA 30098.37
129 2025-11-30 0.7181365 3.714635 0.8245122 7.734926 0.5043586 6.921521 1.0140557 324.122 30230.57
130 2025-12-31 0.7338338 3.742346 0.8467537 7.699746 0.5561542 6.870791 0.9939345 324.054 30364.94
131 2026-01-31 0.7484462 3.708704 0.8093079 7.665160 0.4133847 6.805909 0.9826990 325.252 30501.50
132 2026-02-28 0.7530596 3.680246 0.7878123 7.531750 0.4346201 6.797988 0.9896794 326.785 30640.24
As can be seen, the OASI Trust Fund declined from about 13.097 percent of GDP in 2021-02-28 to about 7.532 percent of GDP in 2026-02-28. That's 5.565 percent of GDP in 5 years. At that rate, the OASI Trust Fund should run out of funds in about 6.767 years or by the end of 2033. A suumary of the 2025 Annual Reports of the Social Security and Medicare Boards of Trustees is posted at this link. It states:
The Old-Age and Survivors Insurance (OASI) Trust Fund will be able to pay 100 percent of total scheduled benefits until 2033, unchanged from last year's report. At that time, the fund's reserves will become depleted and continuing program income will be sufficient to pay 77 percent of total scheduled benefits.
Hence, the estimate obtained from the numbers above match the latest Trustees Report. Setting the text box under the plot that is titled 'Y From, To, Step, Tick' to "0,1.5" should display the following plot:

As can be seen, the size of the Disability Insurance Trust Fund is increasing and the size of the Hospital Insurance Trust Fund appears to be steady. However, the size of the Supplemental Insurance Trust Fund and the total funds in other trust funds is declining.
Analyzing Federal Receipts and Outlays with Shiny
Clearing the 'Y From, To, Step, Tick' to "0,1.5" text box and changing 'Topic' on the left sidepanel to "Receipts' should display the following plot:

As can be seen, Individual Income Taxes (green line) as measured over the prior 12 months reached a low point in 2020 (6.47% of GDP on 6/30/20) and a high point in 2022 (11.46 on 4/20/22) but was fairly flat over the entire 10-year period. Other receipts (black line) also varied during a period, going from 1.507% of GDP on 5/31/22 down to 0.779% of GDP on 3/31/24 and back up to 1.582% of GDP on 2/28/26. Other than that, it and corporate income tax (red line) and social insurance (blue line) were fairly steady over the 10-year period.
Changing 'Topic' on the left sidepanel to "Outlays' should display the following plot:

As can be seen, Social Security outlays (cyan line) were fairly steady as a percent of GDP until about 2022 when it started to rise. These outlays are paid for by Social Insurance receipts so that rise is a key reason why the Social Security Trust Fund is declining. In addition, Veteran outlays appear to have been rising slightly as a percent of GDP over the entire period and Total Treasury outlays have been rising sharply since about 2023.
Changing 'Topic' on the left sidepanel to "Treasury Outlays' should display the following plot:

As can be seen, IRS outlays went up sharply in 2020 but returned to about the same level by 2023. However, interest outlays started rising noticeably in 2021, with Gross Interest outlays rising from about 2.25% of GDP on 3/31/01 to about 4.1% of GDP on 2/28/26. Hence, it appears that interest outlays are becoming a major and growing expense. This is due both to rising interest rates and the growing federal debt.
Note: This blog post is also posted at https://www.econdataus.com/mts2602.htm.


Comments
Post a Comment