Senator Ron Johnson begins questioning the panel of witnesses at about minute 97 of the video (this portion of the hearing is also posted on Senator Johnson's website and on YouTube). He began by having the following chart held up:
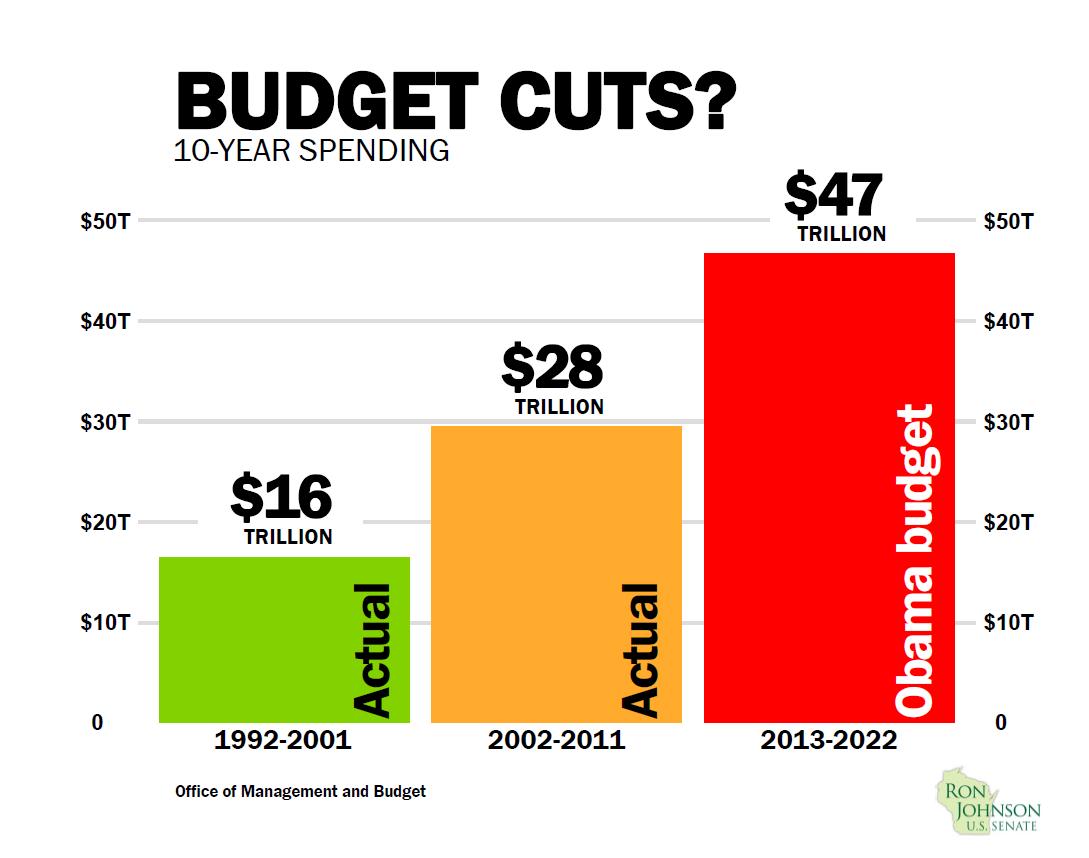
According to Table 1.3 in the Historical Tables and Table S-1 of the Summary Tables from the most recent U.S. Budget, the 10-year outlays for these three periods are 15.936, 27.879 and 46.959 trillion dollars, respectively. Hence, the chart is technically correct.
One of the panelists, Dr. Mitchell, posted this chart on his blog and stated the following:
When Obama released his budget, I did a post showing how annual spending was going to be $2 trillion higher in 10 years than it is today. But I think I’ll steal Senator Johnson’s chart since it makes the same point more dramatically.
I’ve already confessed to having man crushes (in the philosophical sense) on Chris Christie, Marco Rubio, and Rand Paul. If Senator Johnson continues this good work, I may have to become really promiscuous.
In response, I posted the following comment:
I wrote the following about the above chart from Senator Johnson at http://economistmom.com/2012/03/the-tax-policy-and-the-economy-fairy-tale/#comment-70911 :
In addition, that first chart that he [Senator Johnson] had held up was highly misleading. It listed the 10-year spending for the years 1992-2001, 2002-2011 (actual) and 2013-2022 (projected) to have been 16, 28, and 47 trillion dollars, respectively. Of course, the chart should have included the title "THESE NUMBERS ARE NOT CORRECTED FOR INFLATION AND ARE THEREFORE TOTALLY USELESS". He then goes into a discussion of receipts as a percentage of GDP. This is, in fact, probably the most useful way to measure receipts and outlays. As a percentage GDP, outlays in 1992-2001, 2002-2011, and 2013-2022 averaged 19.9, 21.2, and 22.5 percent of GDP, respectively. And Summary Table S-6 from the budget projects that, from 2013 to 2022, discretionary outlays will fall from 7.7% to 5.0%, mandatory outlays will rise slightly from 14.0% to 14.4%, and net interest will rise from 1.5% to 3.3% of GDP. Hence, the big increase in spending will come from interest as rates rise from their current low rates. One other item of interest is that receipts for the three 10-year periods are 18.9%, 16.7%, and 19.2%, respectively. Hence, a part of the debt problem is the drop in receipts over the last decade.
Another odd, if not misleading, comment was made by Dr. Mitchell after Diane [Lim Rogers]. He pointed out that for much of our early history, the tax rate was zero and that zero would be the rate in his fantasyland. This would indeed be a fantasyland in that I suppose that the revenue fairy would have to pay for the armed forces and any other government services Dr. Mitchell feels are necessary. Also, he fails to mention that some taxes, like tariffs were much higher in the past.
The comments were moderated so I commend Dr. Mitchell for allowing the comment. However, I believe that Senator Johnson's chart is highly misleading and not worth the praise that Dr. Mitchell heaps on it. If one wishes to measure the "real" increase in outlays, the numbers need to be corrected for inflation (as they are in column 6 of Historical Table 1.3). And if one wishes to measure the real per-capita increase in outlays, the numbers need to be corrected for inflation and population growth. As mentioned in the comment, the most common and likely most useful way to measure receipts and outlays is as a percentage of GDP.
On the other hand, I am not overly surprised by Dr. Mitchell's admiration for Senator Johnson's chart. I first became familiar with Dr. Mitchell writings when he worked for the Heritage Foundation. The first one that I remember seeing was titled The Historical Lessons of Lower Tax Rates. Following is a chart from that article:
The numbers in this chart are similarly not corrected for inflation. The simplistic argument that "tax revenues nearly doubled in the 1980s" (as stated in the title) prompted me to post an analysis titled Effect of Reagan, Kennedy, and Bush Tax Cuts on Revenues. Following is the short analysis at the beginning of the article:
The argument that the near-doubling of revenues during Reagan's two terms proves the value of tax cuts is an old argument. It's also extremely flawed. At 99.6 percent, revenues did nearly double during the 80s. However, they had likewise doubled during EVERY SINGLE DECADE SINCE THE GREAT DEPRESSION! They went up 502.4% during the 40's, 134.5% during the 50's, 108.5% during the 60's, and 168.2% during the 70's. At 96.2 percent, they nearly doubled in the 90s as well. Hence, claiming that the Reagan tax cuts caused the doubling of revenues is like a rooster claiming credit for the dawn.
Furthermore, the receipts from individual income taxes (the only receipts directly affected by the tax cuts) went up a lower 91.3 percent during the 80's. Meanwhile, receipts from Social Insurance, which are directly affected by the FICA tax rate, went up 140.8 percent. This large increase was largely due to the fact that the FICA tax rate went up 25% from 6.13 to 7.65 percent of payroll. The reference to the doubling of revenues under Reagan commonly refers to TOTAL revenues. These include the above-mentioned Social Insurance revenues for which the tax rate went UP. It seems highly hypocritical to include these revenues (which were likely bolstered by the tax hike) as proof for the effectiveness of a tax cut.
Hence, what evidence there is suggests there to be a correlation between lower taxes and LOWER revenues, not HIGHER revenues as suggested by supply-siders. There may well be valid arguments in favor of tax cuts. But higher tax revenues does not appear to be one of them.
This is followed by a much longer analysis that corrects the numbers for inflation and looks at a number of other factors. In any case, the above chart in Dr. Mitchell's paper is followed by the following chart:
I wrote the following about this chart in 2005:
Chart 11 is titled "Lower Tax Rates Work: Revenues Grew Faster Under Kennedy and Reagan" and shows the average annual increase in real income tax revenues for five time spans. I believe that the time span 1962-1969 was meant to be 1962-1968 as that most closely matches the budget numbers. The table below shows the numbers from the chart and my own calculations from the 1997 U.S. Budget.
First year...............  1953   1962   1969   1977   1981   1990
Last year................  1961   1968   1976   1980   1989   1995
Number of years in span..     9      7      8      4      9      6
Revenue Growth (chart 11)  0.01   4.79   1.53   ----   2.2    1.34
Revenue Growth (budget)..  0.11   4.67   1.55   7.48   2.19   1.56
In looking at Chart 11, the first glaring question is what in the world happened to the time span 1977-1980!? Is it missing because it had a 7.48% growth rate, very much confusing the issue? In addition, why are the time spans of varying lengths?
The above charts are just three examples of how data can be presented in a misleading manner. The first two present numbers that have not been corrected for inflation or population. In addition, they look at relatively short time spans. The last chart seems to be an example of cherry-picking. The data from 1977 to 1980 which goes counter to the conclusion that the author is proposing is simply deleted. In addition, the varying length of the time spans seems suspicious.
These types of charts prompted me long ago to start crunching the data myself and presenting it on my website. Of course, everyone doesn't have the time or inclination to crunch all of the numbers themselves. I only have time to crunch those that especially interest me. However, there are a couple of things that everyone can do. First of all, you can search out opposing analyses which may point out flaws in the data or the way that it's presented. Secondly, you can demand verifiable sources for any data with which you are presented and, when possible, verify it. I can't count the number of times I've come across data that is cherry-picked or just plain wrong. The only way to determine this is to ask for the source and verify the data. If the data is unsourced or sourced in a way that cannot be easily verified (such as "IRS data"), it's probably best to ignore it. It may be unsourced or badly sourced for a reason.
Note: There is a discussion of this post at this link.
I like the way you explain things in your blog but also the fact that you provide the methodology and links to where you got your information from. I was wondering if you ever considered doing a post on whether there is a correlation between labor union decline in the US and income stagnation that has happened since 1980. Has anyone done a study like that?
ReplyDeleteThanks for the comments. The graphs at http://www.econdataus.com/ftyrinc.html and http://www.econdataus.com/wagegap.html do give some indication of an income stagnation that began during the 70s. I haven't looked at the decline in union membership but may do so soon. When I do, I'll post a follow-up comment here. If you send an email address to admin@econdataus.com, I can also send you notification.
ReplyDelete